MCD just completed a parabolic move up, there haven't been too many and they typically end with a pullback. Whether this will end up in a pullback or something worse is too early to know.
Looking at the recent parabolic move, there are several noise candles in orange recently, this helps us define a trend, but nose candles also almost always show up before a trend reversal which could include a pullback or again, something worse.
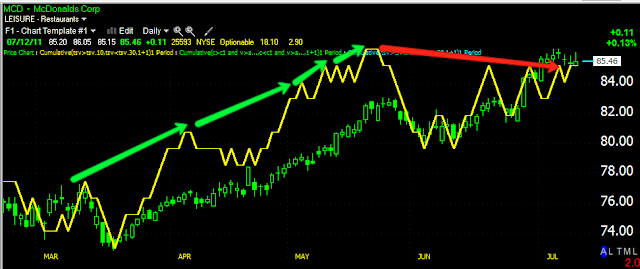
Daily 3C from confirmation to negative divergence
Hourly 3C
The uptrend cycle with accumulation and distribution visible on a 30 min chart.
Recent highs went negative on the 10 min chart.
Today's highs went negative on a 1 min chart-note the highs of the day were tested and that's where the divergence occurred.
The Trend Channel. A move below the $84 area should be taken seriously. A break of the TC could simply lead to a pullback, but the market is a lot different now then t has been the last 2 years, so we must be cautious if we try to buy a pullback in MCD.
Is interest rates about to start going up?
-
Yes, I know - it does not make any sense - FED is about to cut
rates...but....real world interest rates are not always what FED wants it
to be.
5 years ago


No comments:
Post a Comment