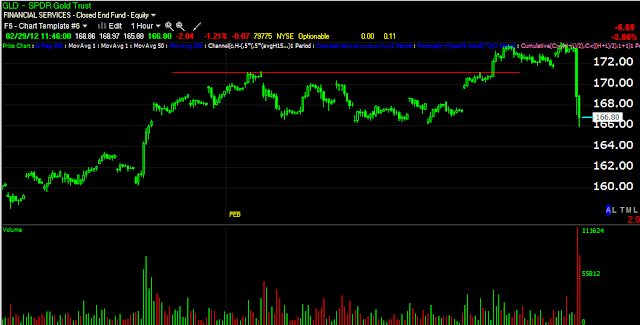
Here is the basis of the trade, there was resistance, I posted this on 2/21. Looking at this chart the day before the red arrow, in the linked post I said this about what would be needed for a head fake move:
"Now we have another possible breakout of the range and again volume is low. To entice longs to buy this breakout, it will have to make a new high and surpass the former breakout to remove any lingering doubts."
The updates since and trade idea has been based on GLD breaking back down below the breakout level, essentially we expected a head fake move and now we have one, I hope some of you had alerts and caught this trade. The long term reasons for a bearish view are also included in the linked post above.
This 60 min chart shows the breakout being a likely head fake move.
Here's the decline that triggered the GLD short.
You can see the break of the trendline on this 60 min chart and the huge uptick in volume, this is what you expect to see on a head fake trade as the buyers of the breakout are at a loss and selling, this gives GLD strong downside momentum and thus the reason for creating a head fake move.
I pointed out last night based on the 3C charts, "I don't think this move in GLD will hold"
The 15 min chart shows a sharp negative divergence, it would seem to me that smart money has been ahead of the curve.
The 30 min chart looks horrible and seems to show smart money positioning for this move down.
Alerts!!! If you are trading without alerts, you are missing opportunities.
The WOWS Options Model Portfolio had a Put in GLD based on the head fake move, it is up 208%!


No comments:
Post a Comment