I won't act like a guru and claim with absolute certainty that I understand what dynamics are either in play or about to come in to play in the market, but I will show you what I have found and hopefully we are on the right track. We have a huge advantage over the Sheeple, 3C isn't perfect, if it was I'd already own my a private island, but I can say in all honesty, it is one of the most unique money flow indicators and effective at that. While we may not know why, we certainly know what.
For example,
Take a look at the $USD, there's a clear reversal there.
3C 60 min $USD not only warned us, but warned us with plenty of notice. The shorter term timeframes actually pinpointed the May 1 reversal in the market/FX market, we even knew what the decline would look like later in the afternoon as the morning saw a parabolic move up.
If we had used the long time Technical Analysis standard money flow indicator, On Balance Volume, this is what we would have seen...
Do you see a signal in the $USD suggesting a reversal?
As for the Euro...
As Greece was without a government, elections polls looked like Syriza would win and throw the EU in to chaos, there was a French election that ended the Franco-German era of cooperation, numerous banks and sovereigns were downgraded, and on and on; who would have predicted the Euro would reverse to the upside?
We may not have known why, but 3C told us what was going on. In my experience and just as a matter of common sense, if you wait for the answers or certainty, your opportunity to make money has already past.
If we were to look at the market as the sheep who blindly follow the dogma of Technical Analysis without observing, learning and adapting, how do you think this would have turned out?
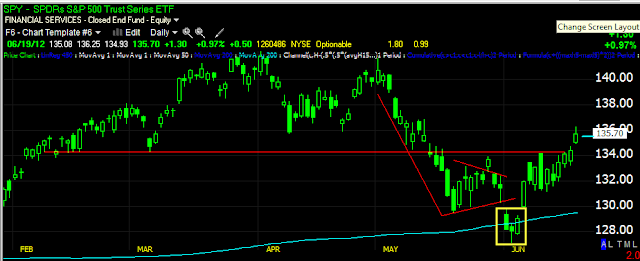
The SPY shows a traditional Head and Shoulders top, the break of the top is one area technical traders would have shorted, a bear flag/pennant formed telling traders that the next leg down was ready to begin; the SPY broke below the bear pennant where traders would have shorted the market, then it broke the 200 day moving average, another place traders would have shorted the market. However, from 3C signals and other indicators, we not only predicted the false break down, but also the move up to follow. It's not a matter of luck or being a guru, it's a matter of thinking for yourself, observing and adapting. Many members have made many excellent money making trades nearly every single day and as far as being short (as the primary trend is very ugly), our shorts were opened at the top of the H&S pattern. Right now in the equities model portfolio (where the longer term primary positions are), 9 of 11 positions, both long and short are all in the green with gains as high as 18% (using no leverage at all), the 2 long positions still in the red are at loss of -0.31% and -0.91%!
As for the F_O_M_C meeting and policy statement tomorrow, I can't tell you what will happen, but we have some interesting findings. The Euro looks like it wants to move higher in a short squeeze, the $USD lower. The market averages look like they want to move higher (I'm talking about the sub-intermediate trend as I believe in the short term trend we will see a pullback).
We know gold has been acting as a sentiment indicator,
today's GLD update was pretty much in line with the
GDX/Gold Miners update , although GLD seemed to offer more in the way of the big picture. The gist of the update was GLD looks like it will pullback, yet the daily chart is more positive now than it has been since this time last year. As you will see below, Treasuries look to be under accumulation which is at odds with the market and FX signals we are getting and the same signals that have kept us on the right side of the market since March.
I shouldn't be speculating like this, but after looking at the Risk Asset close and some other indications, my best guess is that the F_O_M_C will disappoint the market with a lack of QE, in fact I don't even think it will be mentioned (as in the Jackson Hole Speech of 2010) beyond some possibly more dovish
than usual, "
We stand ready with an array of policy tools to step in should market conditions warrant intervention" or something along those lines. This may bring the market pullback I've been expecting and the Euro may be the catalyst for the short squeeze, meanwhile GLD I expect to pullback, but most probably be accumulated for QE possibly later this year. By the looks of treasuries, I would not be surprised if some policy adjustment was made that may be favorable for treasuries.
That's my gut feeling, but I would not go betting the farm on a gut feeling in front of a total wild card. Perhaps 3C has looked so positive lately because the F_E_D is going to do something that will be a market positive, just not immediately a gold positive. Of course I could be dead wrong, but that's my take and relies on a lot of assumptions.
As for the risk asset layout...
Commodities performed well today vs the SPX.
You may remember last week I said the risk asset layout indicators were going to need to get back in line and soon as many had diverged negatively, like commodities, today commods are back in line, which is supportive of higher prices over the sub-intermediate trend.
High Yield Credit has been the most bothersome lately, today it performed well and closed at its highs on the day.
Yesterday I said that High Yield credit was at least making higher lows, it remained to be seen if it would make higher highs as well, today that was answered and while HY credit is still disconnected from the SPX, it is now moving in the right direction. HY Credit is one of the assets used by smart money in a risk on move as the credit markets are so much bigger than the stock market, also credit is traded almost exclusively by smart money, hence the expression, "Credit leads, stocks follow/confirm".

High Yield Corp credit has been behaving much better than HY credit, however I was concerned that it was just trading to the top of its downtrend channel and once it reached the top, it would turn down to reflect HY credit's less enthusiastic (at least as of the last several days) reality. As you can see, HY Corp. credit has blown through the top of the channel, it is likely there will be a short squeeze in the asset which should further lend support to the market. At least for now, that concern is allayed.
Intraday HY Corp. Credit acted well.
For the sub-intermediate uptrend, HYC credit is now in line and supportive of higher equity prices.
Yields which are another leading indicator have recently been a cause for concern as they have diverged away from the market, today they acted well, although the market closes an hour before the stock market.
In white, Yields lead the market, in red they are negatively divergent; I mentioned yesterday it looked as if the found some support, today they rallied off that support.
The $AUD acted well today
For the sub-intermediate trend, $AUD is in line and supportive.
Here on a longer term chart you can see how the $AUD has been a leading indicator at important inflection points.
The Euro and market acted well today
I was a bit concerned about the Euro diverging, but it has moved in line
Energy which had horrible relative momentum yesterday, improved today.
Short term Energy looks as if it could pullback, but it also looks to be the strongest short term between Tech and Financials.
Longer term or sub-intermediate trend, you can see the negative to the left and the positives in Energy at the bear flag, at the market new lows and leading positive now. This suggests higher prices.
Financials were ugly yesterday, today they had much better momentum
Short term 1 min there's that negative divergence (pullback I've been expecting).
Longer term (60 min), Financials are positive enough.
Tech was looking better yesterday momentum wise, today it slipped a bit; I feel good about having taken some risk off the table and locking in some profits in AAPL, the AAPL calls were sold today near the high of the day on the floated rumor which as predicted was subsequently denied, so the rumor was a gift and I feel good about using it to lock in profits.
Tech 2 min looks like it wants to pullback
The hourly shows several divergences and looks good.
As for sector rotation today, as you can see Financials were in rotation, Tech fell out, Discretionary, Industrials, Basic Materials, and Energy were all in rotation. The flight to safety trades all went out of rotation today.
While copper itself is close to confirmation with the SPX, FCX is in confirmation (SPX in red).
Transports are also confirming if you are in to Dow Theory.
Here's TLT/Treasuries saw some intraday negative action, but...
as mentioned, there seems to be accumulation here which is odd considering it usually trades opposite to the market.
The daily chart is even more positive, this is why I suspect something positive will be announced tomorrow in the Treasury space.
As for ES tonight...
Because of the move higher in ES, 3C is not scaled properly, there was a leading negative earlier in the day which I have marked, there was another at the rumor that ramped the market and then was denied, as I said, it was a gift and I'm glad I used it. In context to the normal hours, we have a large negative divergence in ES right now, perhaps this is the start of our pullback.
EUR/USD
The Euro is above the resistance zone, but looking a little out of gas here, this would also make sense with a market pullback. The red arrow is the close.
So that's where we stand, what I feel are the probabilities, however tomorrow will be a very volatile day; as I always warn in front of a F_O_M_C policy announcement, "Beware the knee-jerk reaction", it is almost always reversed.
I got about 3 hours sleep last night, but I will be back with more later.


No comments:
Post a Comment