As for Risk Assets...
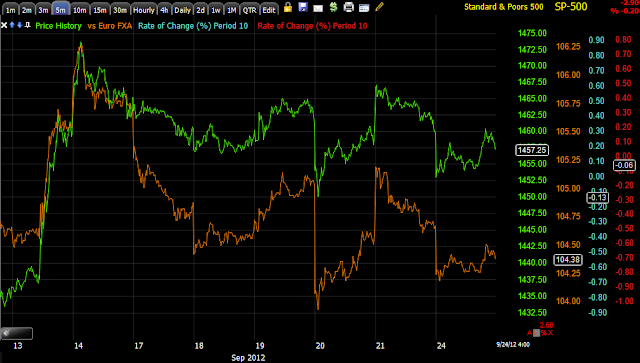
Commodities underperformed today (brown) vs the SPX (green), but hung very close to their FX relationship (Euro in light blue).
Longer term commodities out-performed on a relative basis before QE3 and have underperformed since, the question being were they marked up pre-QE as commodities have always fared pretty well in QE periods and are now being sold in to or are they being dropped to pick up on the cheap, we can't tell from the index alone, but rather have to look at each class. As mentioned earlier today, USO/Oil looks set for at least a bounce higher, if there's decent negative divergences in to a mov higher, that helps answer that question.
Yields have acted like a magnet for equities in the past and have called some decent reversals for us, they have broadly underperformed, especially longer term.
A bit longer...
Since they reached reversion to the mean on June 4th at the market bottom, they haven't performed well and this would normally be considered a very negative signal.
The $AUD isn't telling us much, but it doesn't seem like the carry trade is being put back on at this point.
A little longer term, the divergence isn't horrible here.
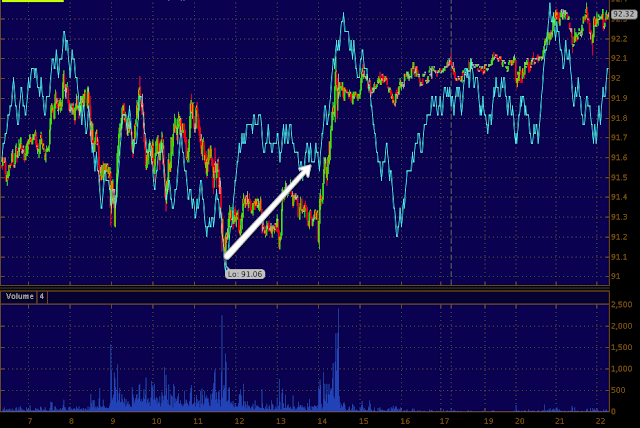
The Euro under-performing a bit on some $USD strength.
Euro a little longer term, from the signals available in the Euro, it looks like near term (5 min chart) we'll see some upside in the Euro, which would generally mean broad market upside with it, however thus far the charts beyond 5 minutes, 10, 15, 30 and 60 don't look good, perhaps a bounce followed by a lower low? Believe it or not, the $USD thus far has almost the same confirmation which doesn't make a lot of sense in a dollar debasement environment.
Energy has lost all momentum here on a relative basis since QE 3, I covered the USO short Friday I believe, but as mentioned today it does look like USO will see a bounce. Again, short to intermediate charts look good for a bounce, longer term (but still post QE3) don't look so hot, similar to the currencies that it is closely tied to.
Financials have also not performed well, but they also have a shorter term positive divergence building, but once again around the 10-30 min timeframes they don't look very good.
Tech pre and post QE 3, they look like they should at least fill the gap, I'd think with the environment described so far, probably a bit more, but once again, 10-30 min looks very bad, leading negative pretty deeply so a bounce would provide good information just as the dip has provided some decent information, which is to say there are some positives, but they aren't anything out of the norm.
High Yield Corp Credit has finally broken down, the performance today was not on par with even the SPX, but the momentum on the downside has subsided, I believe it could bounce, but it is showing weakness even close in at 5 mins. Perhaps Credit diverges from a bounce?
a little longer term...
This Junk Credit, the same is true for JNK as HYG.
Sectors today saw defensive areas pick up like Utilities, Staples and Healthcare, Industrials were also up while tech was off.

Sectors over the last 2.5 days, it appears to me that Tech and Financials could be near a rotational low which would fit with a short term bounce.
As for futures tonight...
Crude shows a 2 pm positive divergence, I posted on a positive divergence in UO as well, even said I'd consider a speculative trade there long.

While ES (SPX Futures) are up in overnight trade, they still have a weaker 3C disposition than the NASDAQ futures as seen most of today in what looks a little like a bifurcated market.
NASDAQ futures are broadly in line on the 1 min chart thus far.
The SPY as mentioned in the market updates today saw the 1, 2 and 3 min charts get ugly after looking very strong toward the end of the day, however the 5 min chart as I posted is still in a positive position, this makes sense with everything else above so a continued effort to close that gap at least seems very likely and I'd imagine with the downdraft in the market since QE3, it's probably time for an upside correction at least, so seeing how 3C performs in such an environment could really answer some questions and even open up some nice trades. The problem I see for the SPY on the upside is that after 5 mins, everything starts to weaken, the 10 min is marginally positive, but lost some ground and the 15 min is not at all in a position I would consider positive. This would be typically at least a swing move on a 15 min chart and it's not there as of now. The 60 min and 4 hour post-QE3 have deteriorated badly as well and as shown today.
The DIA is one of the better looking of the averages with at least a 10 min positive divergence. We'll see if CAT has an effect on the Dow as they came out with some not so great news after the close.
The QQQ looks good too to about the 5 min range, it is the 10 and 30 min charts overall that look bad.
AAPL showed some late day positives, but again all positive momentum in 3C stops at 15 min and the 30 and 60 don't look good.
Finally the IWM has good positioning relatively speaking on the intraday charts, but again at 10 mins there's ugliness and 30min especially with the hourly deteriorating.
I'd think if the market was brought down to accumulate, we'd be seeing much larger divergences and on timeframes that are significant like 15-30 min and that in most cases is where they get ugly.
As it stands, on some price weakness for those who are nimble, you might consider some speculative longs, I wouldn't want to over-commit to anything until we see what happens on a move up as it appears that we'd likely see negative divergences which would set up some short positions, if they were really bad they might set up some very nice short positions, but we need that movement to see. Since the 14th it's been pretty much downhill which gives us information, primarily at this point that the divergences aren't huge which if the market was being dropped to buy weakness for QE3, I'd expect much bigger positive divergences.
We haven't had much of a chance to see any real upside and how the underlying trade behaves in that case, GOOG may be a preview as it saw negative divergences in to upside today, as I stated I don't think GOOG is done as we don't typically see "V" reversals, it's more of a process, but if GOOG continues to go negative on higher prices or a rounding/flattening, I suspect we may se something very similar in the broad market.


No comments:
Post a Comment