There's a clearer picture emerging now, however as I have been trying to focus primarily on data since QE-3 was announced to determine whether there was a reset in underlying trade or whether the longer term charts are still valid which would be the case if QE3 was priced in to the market (and there is some evidence it may have been as I showed you last night: transports, Surprise Economic index diverging, etc), that would also give the tone of QE3 a very different flavor from conventional wisdom. However even if it was indeed priced in, that doesn't necessarily mean we either have a risk on or risk off market as we have grown use to since March of 2009, as mentioned last night, there's some evidence (AAPL vs BIDU or QQQ vs DIA) that there could be a bifurcated market in which certain industry groups and stocks behave well while others fall apart, while I think we'd have a distinct advantage in this environment, I also don't believe that it could last long.
We have more pieces to the puzzle and some parts seem to be emerging, but I think the best course is to remain patient and continue to let the market give us clues and evidence before jumping to conclusions based on conventional thought or based on contrary principles, the market doesn't have to be hot or cold, it can be whatever it chooses, we just want to understand what it is moving toward and align ourselves with that.
Here are the opening charts and some of the pieces of the puzzle.
Last night I posted the difference between the QQQ chart and the DIA with the DIA looking a bit more lazy than the Q's. While the Q's have seen a deeper decline as AAPL is over 20% of the NASDAQ 100's weight, the intraday effort between the two is certainly noteworthy as the Dow thus far looks lazy while the Q's (even at a deeper loss) seem to have more enthusiasm.
QQQ a.m. trade...
DIA a.m. trade is much more flat.
DIA 1 min continues to move in line with price on the 1 min chart as it did all of Friday.
The 2 min chart shows more weakness on Friday
As does the 5 min chart, but we do at least have a slight leading positive divergence. It's been a long time since I've seen breakaway gaps and other gaps remain on the chart, in fact about the time HFT started dominating the market, gaps started to become a thing of the past as we saw earlier in the year, almost evert single gap was filled. The DIA has an obvious gap above.
DIA 60 min chart doesn't look good, even if we just look at it since the 13th/14th, in between 1 min and 60 min there are a lot of possibilities and it is the possibilities we want to pay close attention to. As always, price action alone is often deceiving.
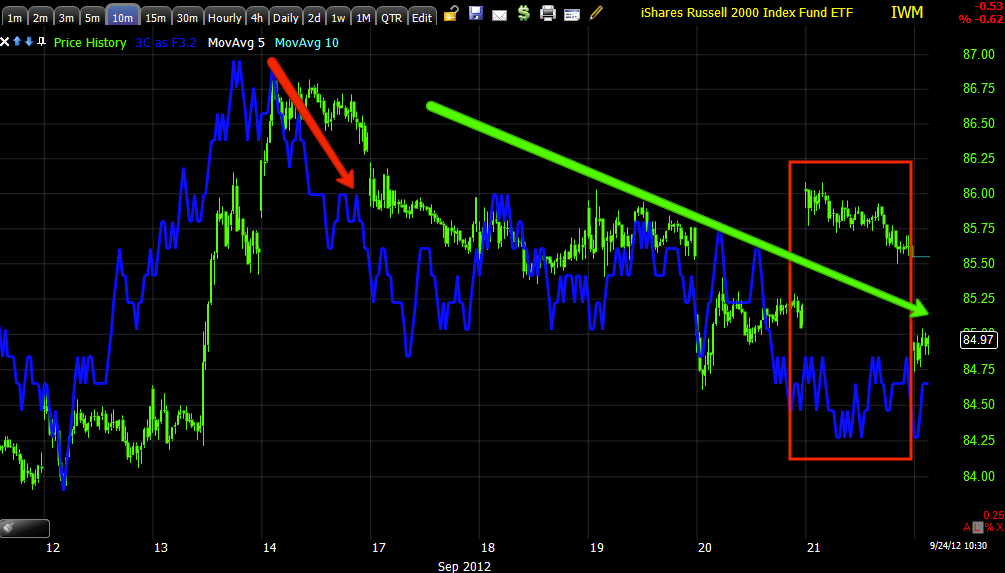
The IWM 2 min from Friday with a bit of a leading positive this morning, I'd think it will gun for the gap.
IWM 10 min (intermediate timeframe) didn't look good Friday at all.
I don't want to mislead and say there aren't some decent looking scattered timeframes in the IWM, there are, however even if we just look as of the post F_O_M_C, the 60 min chart (the longer charts tend to ultimately be the most reliable) doesn't look good as it leads negative.
QQQ 1 min chart looks a lot better than the DIA 1min chart and this morning has put in more effort, still an honest assessment is the Q's are more oversold and this is still a.m. trade, but this difference was noticeable Friday afternoon as well.
NASDAQ (NQ) futures 1 min look decent with a leading positive divergence, a move to the gap is likely.
On the other hand the hourly chart is ugly as it was in the QQQ 60 min.
The SPY 1 min has an advantage this morning with 3C in a leading positive position on the gap down, I see the SPY is the only average thus far to fill the gap as the rest move toward it.
SPY 2 min looked quite bad Friday and doesn't look all that good today, so the question is how much energy does the 1 min chart have? Will the 2 min chart gain any strength or deteriorate?
Most other timeframes in the SPY aren't looking good in short and intermediate timeframes up to 15 min which is leading negative.
S&P futures (ES) 1 in is also leading positive.
The hourly leading negative.


No comments:
Post a Comment