It doesn't matter too much what the market does price wise from this time (meaning 2:30-close after the op-ex max pain pin is no longer that important).
The reason why? Simply,
if we have some very negative signals in to the close, the probabilities are higher that next week the market picks up where the actual signals left off, not where price left off, we have seen this numerous times whether it be day to day trade or over even a 3-day weekend.
In fact, if underlying trade is suggesting a move down via negative divergences, then a strong closing ramp draws in the weekend warriors who work 9-5 and place their limit orders "based on what price did", over the weekend or early Monday morning before they head off to work. THESE ARE THE SUCKERS THAT GET CAUGHT HOLDING THE BAG IN A BULL TRAP SCENARIO, it's for this reason that EOD price action on a Friday after the op-ex effect of "Max Pain" has diminished is of little concern to me, but EOD 3C signals are very important to me.
So lets take a look, I'll also be confirming in some other assets like leading indicators and several other types of futures/credit, etc.
Russell 2000 Futures
1 min TF, there's a positive divegrence leading in to regular hours (9:30) with the typical head fake just before a reversal starts, I imagine higher prices were part of the max-pain pin, as those contracts (hypothetically) are closed out at a loss there are fewer contracts and the transition from Friday's specific Max pain operation transitions back to the larger cycle operation with clear leading negative divergences.
However as I have maintained since the idea of VXX calls came up yesterday,
I see them as a "Short DURATION" position, that's why they need the leverage.
At the 15 min chart of R2K Futures, we have a positive divegrence sending futures higher and today's price action is in line, no negatives because this is a longer timeframe for more serious trends, a pullback doesn't effect this trend and isn't strong enough to even show up here.
As for the migration (strength and therefore probabilities the move takes place) of the intraday negative divegrence, here's the DIA as an example...
1 min leading negative
migrates (meaning the 1 min negative was strong enough to move over to the next longest timeframe ) to the 2 min.
The 3 min is leading negative,
***Note how ALMOST all of the leading negative divergence on this timeframe is exclusive to today.
The DIA 5 min chart DOES NOT see migration of the negative divegrence.
This means while the 1-3 min signal is strong, the 5 min signal is much stronger as the first timeframe that represents institutional activity, thus any pullback is likely to be short in duration (as explained yesterday when entering the initial position). Today confirms what was seen and expected yesterday on the entry of VXX calls.
The green arrows show 3C in line with the price trend or confirming the price trend.
Other Averages' divergences... I'm showing the longest charts w/ negatives, there are negatives on shorter charts, there's just no reason to show all of them.
IWM negative out to the 5 min, almost all from this afternoon.
QQQ 5 min also leading negative, there was earlier damage, but the majority was done this afternoon.
*I use the SPY as a different example...
SPY 3 min positive in to the lows, a negative today, there's a gap, that makes an attractive pullback target.
SPY 30 min shows something very different, this is a very strong timeframe, it has nothing to do with a 3 min chart.
Note distribution in to the F_O_M_C, you may recall my opinion that the F_O_M_C was leaked and the charts I showed of the $11 move in gold 3 minutes before the policy statement was read and gold heading much higher right after.
The 3 - 5 min chart represents a short duration correction/pullback, the 30 min chart represents the upside we've been expecting leading to highs that can easily be shorted as retail chases and creates demand that Wall St. needs to put on positions the size they do without sending price against them.
Longer charts like 60m, 2-4 hour and daily+ represent the primary downtrend we expect, this is why we want to use price strength above certain levels to short in to THE EXACT SAME WAY SMART MONEY DOES.
SPY 4 hour represents both the bounce to the upside or rally aas well as the overall negative divergence
The SPY 4 hour represents the heavy distribution already in the past, the massive damage to the market . I drew in 3 candles, 1) a short term pullback, 2) a loss of momentum and reversal to the upside, 3 the upside move starting and 4 is the rough area I'd expect price to reach before entering shorts in size, this represents the area retail WILL chase prices (the confirmed breakout) and create demand, which is what Wall St. (as well as ourselves) needs to sell in to and be able to sell or short (they are the same thing on the tape). Wall St. needs it to keep price from going against them, it's largely a volume issue, for us it's not so much a volume issue as it is getting the best entry and the lowest risk.
THIS IS THE DIFFERENCE BETWEEN THE PROBABILITY OF SOMETHING HAPPENING AND A HIGH PROBABILITY TRADE WITH AN EXCELLENT ENTRY, LOW RISK AND GOOD TIMING.
THE INTRADAY 5 MIN 50 BAR THAT MANY INTRADAY TRADERS WATCH IS VERY CLOSE TO SEEING A BEARISH INTRADAY BREAK, MY TREND CHANNEL IS ALSO RIGHT THERE NEXT TO A STOP OUT FOR LONGS.
The larger 60 min 50-bar trend shows what I think are reasonable areas for a short duration pullback, they can move toward these levels and still not break the new trend.
My momentum screen set to intraday 3 min shows momentum (top) failing, RSI is neg. divergent, MACD (setting: 26/52/9) is negative and Stochastic (period:50) has also turned negative.
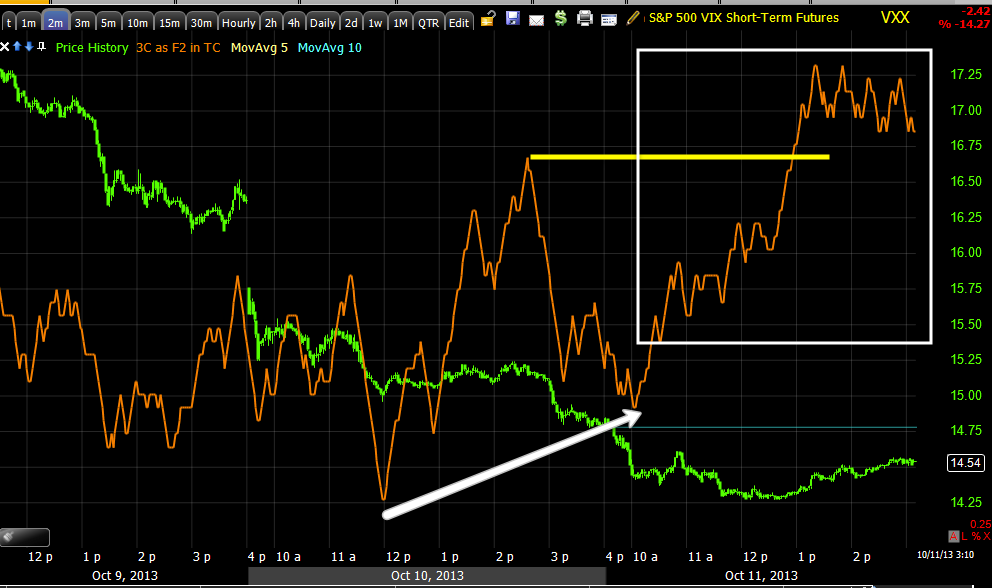
As for VXX, VIX short term futures...
The 2 min chart I wanted to see make a new high earlier today has done so, it is leading positive and in good shape for the VXX position that is in place.
You can see our VXX Put from earlier in the week and the leading negative signal that caused us to put it on, leading to a
+40% gain in 4 hours and now you can see a 3min leading positive divegrence that is even more extreme than the previous negative divergence.
The 5 min chart shows a lot more than you might realize. At
"A" there's a breakout above a triangle, this is what traders chase, they call it "confirmation" which use to make sense, now it is just used against them. At
"B" we have the breakout move they will chase, if you look at this as a 4 stage cycle (as the market is fractal, this would be stage 2 mark-up). At
"C" we have stage 3 distribution/top and this is where we are short with puts.
Remember, "From failed moves come fast reversals", this is because Technical traders are taught that is a move like a breakout from a triangle fails (TA says it shouldn't", then you should reverse your position and go short. Some traders will do that, others will hold on and see if their stop which is placed right under the triangle, holds. At "
D" price fails and the longs are stopped out as their stops on the books (totally visible-would you show your cards playing poker?) and everyone knows exactly where they are anyway, just below support. At this point supply picks up as additionally shorts step in on confirmation of a failed technical price pattern, between stops and additional new shorts, there's plenty of volume for Wall St. to accumulate in size and on the cheap. At
"E" we get the move ABOVE resistance that
isn't suppose to happen according to TA, this squeezes shorts and encourages retail longs to but, this creates demand which sends prices higher, it causes more shorts to be squeezed creating more demand and Wall St and ourselves can sell in to price strength
(Wall St. also has the demand/volume they need for their larger positions).
As I said last night and Wednesday when entering VXX calls, everything still looks to be exactly on track.


No comments:
Post a Comment