These are just the averages and the VXX / VIX Futures, I'll cover some others in another post as these move so quickly.
There's significant damage done that is consistent with a head fake move.
This is the head fake area, it's in the right place, the nearly 2.5 trading weeks of range makes it the most obvious area to shoot for and it creates our "Chimney".
It's my gut feeling from the 3C charts that the serious damage is done, the negatives are confirming a head fake move, but around 2 p.m. or so, it looks like the market will try to ramp. I mention this often, in my experience after an op-ex pin wears off around 2 p.m., price can do anything, it's the 3C charts that actually pick up where they left off on Friday, not price.
So I'm thinking we will see an afternoon or closing ramp, but the damage is done at the head fake area. My next post will either solidify/confirm this view or not.
SPY
10 min with a very sharp leading negative divegrence, this is typical of a head fake move ending, the speed and depth of the divergence on a strong chart.
This is the entire 10/9 cycle from accumulation to mark up to distribution and top with the head fake which is the typical transition to decline.. 3C is at a new low for the entirety of the chart while prices are on the other end, that's a big divergence.
The 5 min chart also falling off VERY fast when zoomed in to intraday.
3 min in the head fake area confirming distribution which helps us identify a head fake move vs a real breakout.
The 1 min is leading negative, but see the intraday positive in white, it's very insignificant in the big picture, but it can be very significant in price movement this afternoon if that's all you are looking at.
QQQ
15 min showing that same fast decline in the head fake area
10 min chart doing the same
2 min chart is leading negative overall, but this is that same intraday positive divergence I suspect will cause some upside after the 2 p.m. pin passes (2 pm is an estimate, not an actual time for option expiration, but by then, most contracts are wrapped up.)
IWM
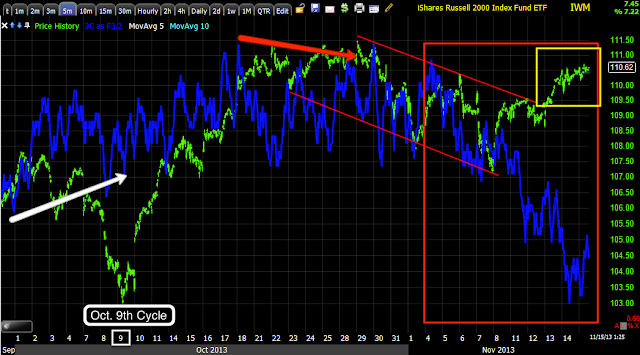
IWM 30 min without the channel shows a leading negative divegrence
15 min chart with the channel, a clear leading negative divegrence and a big move today alone
The 5 min chart at the Oct. 9 cycle and the channel buster in yellow with a leading negative divergence/distribution, this should make for a great example of Channel Busters.
2 min intraday falling off fast intraday, the IWM may not see the same attempt to ramp in to the afternoon.
The 1 min chart shows the same thing, including the probability for afternoon action, I like SRTY long as a short play for IWM, if IWM can bounce in the afternoon, then I may consider a put option.
IWM 1 min intraday not looking good
Index Futures
ES 5 min leading negative, but like SPY a small intraday positive in to the afternoon?
NQ leading negative
TF intraday, also showing intraday weakness for the R2K, looks to be the laggard for an afternoon ramp
VIX/VXX
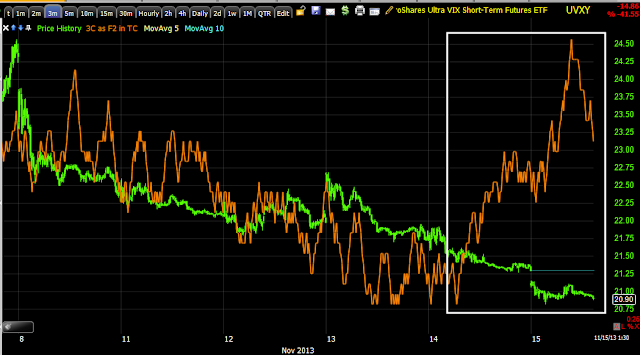
This leading positive started suddenly late yesterday, I suspect China was part of it as they were last time and the same thing happened last time they withheld liquidity and it was this time the next day (Friday), EXACTLY like today.
3 min leading UVXY / VXX
10 min large leading.
15 min leading VIX Futures, there seems to be a REAL reach for protection and a strong one.
Even 60 min VIX Futures leading positive starting yesterday, again, a VERY strong signal, it looks like a lot of fear.
Is interest rates about to start going up?
-
Yes, I know - it does not make any sense - FED is about to cut
rates...but....real world interest rates are not always what FED wants it
to be.
6 years ago


No comments:
Post a Comment