The bottom line for today thus far is PCLN has done what I hoped to see for a second day, I really like the way this is developing, the trade is coming to us as we expect, however if I have to decide right now whether to fill out the remaining position, I think I give it a day or so more unless the afternoon trade makes a significant change. However if I had no exposure to PCLN (I prefer to phase in to positions like this which is not the same as "Dollar cost averaging" because this is part of the risk management plan from the start, not a reaction to a losing position) I'd have no issue with adding half of my intended full size position on a day like today or perhaps on a bearish confirmation candle which could develop today because the gap up would allow for a bearish engulfing candle today
This is the last PCLN update from yesterday PCLN Update...
"Thus far today, the daily candle in PCLN is just as imagined and so far perfect, another star/Doji in the area with a bearish confirmation candle would give us an appropriately sized reversal process rather than a "V" shaped event that is very rare....
"Yesterday's large, bullish candlestick was VERY unlikely to just reverse down today no matter what 3C says, it's too tight and no reversal process, there's a reason for the process and why "V" reversals are so uncommon....
Today's star is a near perfect second day candle, one more would make the process a little wider and a bearish confirmation like a bearish engulfing candle would round PCLN's reversal process.... So, I'm not making any moves in PCLN yet, but what we hoped to see yesterday did develop thus far today. Another day or two could be the sweet spot to fill out the rest of the position."
Today's charts and some longer charts that haven't been in recent updates.

The "seemingly" bullish Rate of Change to the upside is one of the earliest signs of a top about to take hold, look at tops and the trends just preceding them and there's almost always a change of character that looks bullish with increased ROC on the upside just like 2013 as PCLN peels away from its long term character.
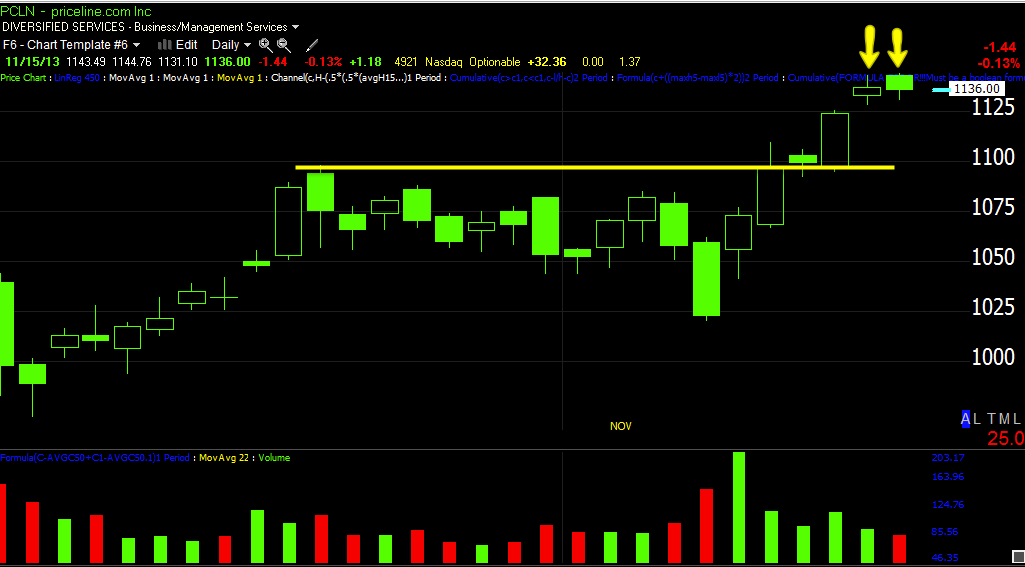
I said I wanted to see something like a Doji or a Star candle after Wednesday's strong candle, we got a star yesterday which helps create the reversal process and is a well known reversal candlestick and yesterday as you can see above I wanted to see another to give the top area a wider/rounding area as "V" shape reversals are uncommon and unreliable, today we have another star so far, but since it gapped up, if it closes significantly lower we have a confirmed reversal pattern.

1 Is the start of the cycle like the rest of the market, this is why I always say the market is the most important thing in picking a stock and people get it backwards, the market has about 66% of the influence over any given stock's movement any given day.
2 The down channel made for an easy head fake area and channel buster.
3 Is the first Channel Buster sending price BELOW the Channel
4 Creates the second Channel Buster and these are used for reversal momentum
5&6 Is the Bull Pennant from the Channel Buster, but also the start of the head fake move. We showed charts that PCLN would break out from this pattern to the upside and it happened 45 mins. later.
7 This is the fulfillment of the breakout above the range, the head fake move.


Each indicator above is constructed completely different so they would not show the same thing unless it was there.


This is in leading negative position, but I;d prefer to see 3C leading negative to the downside.


There's plenty of confirmation to call this a head fake move.


If you want more confirmation and play it safer, the Trend Channel has held the entire 2013 trend without a single stop out, a stop out (now at $1021) on a close would show a huge change in character and it's VERY unlikely PCLN would come back from such a break.
Often price will bounce around or loiter after the channel is broken, but they almost never come back especially with a trend this long.


No comments:
Post a Comment