This is a little bit of a tricky area, especially for short term traders or day traders as the dominant trend will be lateral/sideways which is usually pretty choppy and can create a meat grinder, just imagine a rectangle, fairly tight and price bouncing inside it.
For longer term trades which is what we have been most interested in with this bounce, entries are going to start popping up, the best will typically be on upside volatility.
On an options expiration Friday (every Friday w/ weeklies), price generally un pins from the max-pain area around 2 p.m.
The main levers are failing, for this bounce HYG was the main lever set in motion August first and led the market the entire time the base was being constructed (q week) as well as almost through the entire bounce. If we look at it from a stock cycle/stages, we're in stage 3 (top/distribution) now.
This is the targets that were published on the first day of the bounce, August 11th, TWO TRADING WEEKS AGO IN
Daily Wrap...
The first chart was a rough guess of what the IWM would look like and where there were two points of action, the first being a slight pullback where longs for a piggy back trade could be entered and the second was the upside pivot and more important short entry.
This is the actual chart from that post on 8/11 and commentary...

"Here's the base we expected to form just a little over a week ago, the 3C divergences during this base have been posted numerous times and there's one above (QQQ 10 min). We started a move up today which I expected to see early weakness as of Friday's "Week Ahead" and "Daily Wrap" which started today with a 50% retracement from intraday highs. at #1 we have the expected very near term pullback and reversal process, this is where I'd enter any call positions (speculative) or swing trades (which I prefer using a market average like the IWM with leverage like URTY - 3x long IWM). While there will undoubtedly be smaller/short term surprises along the way, the general idea is for the base to send the market higher along the lines of a swing trade. At #2 we have the most important part of the analysis which would be the start of the reversal process back to the downside, THIS IS WHERE I'D WANT TO CLEAN UP LONG POSITIONS AND START ENTERING ANY REMAINING SHORT POSITIONS"
This is what the IWM actually did...
The above was posted at the white arrow, there's a small pullback which was to be used for any long trade entries. And the second pivot where shorts would be entered, was just above the white trendline if you look at the chart above from 8/11.
This is the SPX chart from the same post on 8/11 with several targets from minimum to the expected upside @ "B" above the psychological level of 1950. "C" was added as the next likely stop for the next leg down.
Here's where we are.
One of the SPX upper targets for the bounce were
right in this area, as stops would likely be placed (short stops) right about where the SPX broke below the bearish Ascending Wedge, so a move to that level was reasonable, a move back inside the wedge would be difficult as the trendlines were extended.
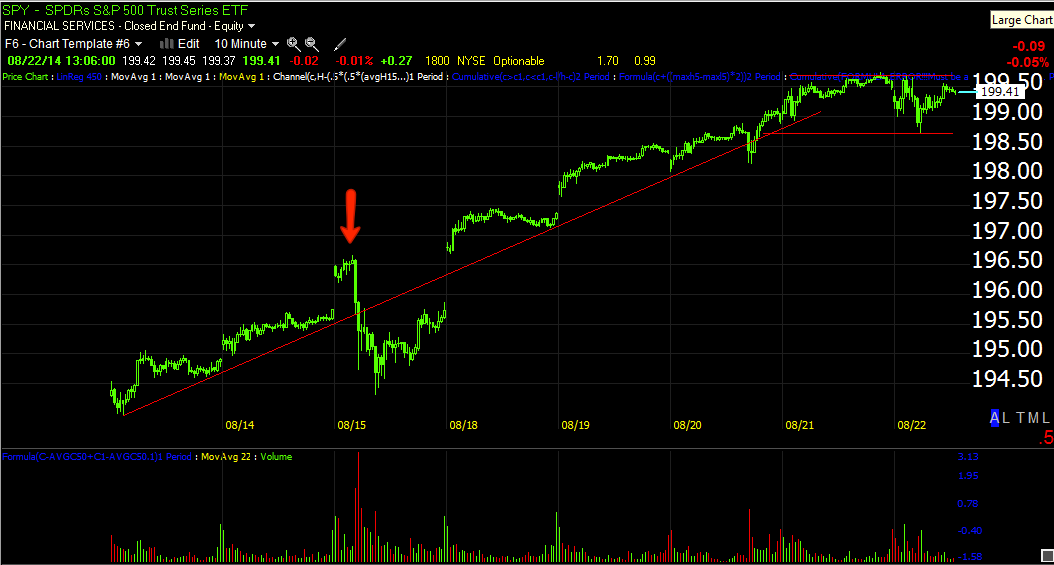
This is the SPY 60 min trend, the only disruption was the Ukraine fabrication of a Russian Armored column being destroyed last Friday (red arrow). However note the turn to the right and lateral reversal process expected this week after about two more days of upside from Friday's
The Week Ahead...
"
Today really skewed a lot of things (*Ukraine disinformation of Russian convoy destroyed*), but just going from the trend prior to today, it wouldn't surprise me if we were very near the end of this bounce, maybe a day or two more (This week*), but I suspect we'll be seeing a lot more lateral (sideways) trade next week, a reversal process."
We got about 3 days , but I believe the reversal process started Monday and as you can see the trend lines are now flat the last two days.
Here's another way of looking at it on the QQQ, the 10-bar moving average has Rate of Change (orange) applied to it which has clearly turned down.
From a daily ES point of view, this has been the lowest volume rally of the year with the last two days setting new record low volume for SPX futures exclusive of holidays.
VWAP may look different to you for the simple fact it's no longer trending up, but sideways.
HYG has been the lever for this bounce, it's certainly not demand judging by volume. HYG led since the base started on 8/1 through 8/8 and led through most of the rally /bounce until a few days ago when they reverted to each other, now HYG's relative performance is lagging badly.
HYG intraday vs the SPX
HYG's longer term 30 min chart positive at the lows/accumulation and negative now/distribution.
The 15 min chart with a relative and then leading negative divegrence.
And the 5 min chart.
The 2 min chart's trend is a great visual of when and where underlying trade moved from accumulation to in line to distribution.
As mentioned several days this week, VIX futures are seeing accumulation, I inverted the SPX price (green) so you can see the "normal" correlation, VXX is definitely outperforming the SPX...DEMAND.
The Flight to Safety TLT/Treasuries (20+ year) are also outperforming, remember the accumulation on the F_O_M_C minutes knee jerk dip.
Our pro sentiment leading indicator had been in line with the SPX through almost the entire bounce and started going negative a couple of days ago and continues.
This is TICK, note the strong move to -1500 earlier today and a flat trend now.
I would normally think we'd have about 3 more days or reversal process, but because this move was so straight-line with few pullbacks, it's probable that the reversal process will be faster/tighter than normal, the IWM may be the exception.


No comments:
Post a Comment