I'm specifically using the Russell 2000 for 2 reasons, (1) there are so many charts dealing with one index, I don't think you'd get through this post nor I get it out today if I covered more than 1 index, (2) the R2K is the average that "should" lead all risk on moves, it's a broad index encompassing many areas of the economy and the heart of the economy which is small to mid cap business. If you ever watched Bernanke at his bi-annual Humphrey-Hawkins Congressional testimony, interestingly when he talked about the market he chose to talk in terms of the Russell 2000 which is a bit surprising being the Dow Industrials or the S&P-500 are by far much more common / familiar household names, but Bernanke recognized the Russell's impact as a market lead ing Index and chose to use it as his market benchmark at least in Congressional testimony.
Lets start at the beginning with some long term 3C charts, remember the longer the chart, the heavier the underlying money flow trend or the stronger the implications of divergences. Often many long term day or multi-day charts won't have the detail that intraday charts will have simply because divergences from price or the underlying flow of funds which may be more than enough to move the market, are not that big that they'll move the market in any significant way on the longer daily/multi-day charts, unfortunately watching the market all day every day we tend to watch shorter term action as you can only make the same observation about longer charts so many times while the shorter term charts are more fluid, dynamic and call out shorter term trends, which can be substantial such as the early October accumulation we saw in to the mid-October lows which led to our forecast that we'd see a monster, face ripping upside rally that would change sentiment from full on bear as it was at that point to full on bullish, I'll admit though that while I suspected new highs were possible if not probable as we do have a Broadening top in place with 5 points of contact, the intensity and more so, the length of the move even surprised me, the market is always extreme in sentiment changing moves and this move was meant to be a sentiment changer,, but as I have maintained since BEFORE the move started, it's a means, not an end as too many people were calling a bear market at the October lows, which I had said at the time made me very uncomfortable as bear markets appear when they are least expected and economic information is generally on the upswing; just look at the major bear markets, 1929, 2000, 2007, all new time highs as they topped and turned.
From a conceptual point of view, think about our Head and Shoulders Concept, the 3 areas I'll short a H&S top and the one I won't. Or the recent BABA Channel Buster concept in which we predicted where BABA would pullback to at least 2 weeks in advance and before the first day of pullback, in fact BABA was up +4.59% on the day we posted the pullback was coming, Alibaba (BABA) with the pullback starting the next day.
These micro versions of head fake concepts are really no different than the macro version. This is why all of our concepts are able to be used in ANY asset class and in ANY timeframe you wish to trade.
Take HLF for a quick example.

For all H&S tops, I'll short the head #1, the right shoulder #2, I WILL NOT short the initial break of the neckline as this is where most traders go short on confirmation of the H&S, this is also where most shorts are shaken out. I'll only trade this area with good signals, but the concept is to wait for new shorts who have placed their stops above the neckline that is now resistance, to be shaken out with a volatility shakeout ABOVE the neckline. THIS IS THE 3RD AND FINAL PLACE I'LL SHORT A H&S TOP.
The point in this concept is not a H&S top, it is common price patterns that all technical traders know being used against them and using that to our advantage.


The break below at the October lows is when everyone started calling for a bear market, the moment in which I said there are too many people on the same side of the trade in a zero sum game, "I suspect a big move to the upside is coming which will then lead to a bigger move to the downside" and this was before we had any evidence of either, just Mass Psychology.
The move had to be strong enough to overcome the overwhelming bearish sentiment at the time which you may have forgotten, but I even posted that we'd see a face ripping rally, when no one believed we'd even see an upside correction and that the job of the rally is to get retail to believe in the market, again something that seemed impossible at the time with EVERYONE calling for a bear market and as the Fear and Greed Index was hitting ZERO for multiple days, the strongest bearish sentiment on record. I even challenged you to bookmark the post, that the move would be so strong that even with advance notice and bookmarking that post, you'd be scared to short the market as emotionally it would look that strong and seem that crazy" and here we are.
Now a closer look...

In much the same way as the downside move created momentum via a series of short squeezes at various stop levels and a long amount of time before traders trustted the move enough to go long, we are at a similar momentum building area ABOVE the Broadening top which causes traders to think that just like the failed break below the top, the breakout above makes this an invalid chart pattern, it is not.
The last move below taught traders no matter how strong the move down is, BUY THE DIP, so expect the next move down even stronger not to be met with full bearishness like the October lows, but a renewed sense of the deeper the correction, the better as retail will BUY THE DIP, this time the market simply won't come back
THIS IS THE SAME HEAD FAKE, MOMENTUM, MASS PSYCHOLOGY CONCEPT AS HLF AND BAVBA.

The green arrows are 3C confirming price and the red box is a large leading negative divegrence on a head fake move that came just before the downside move that erased a 5-year bull market + another 15% and most of that in 8 months!
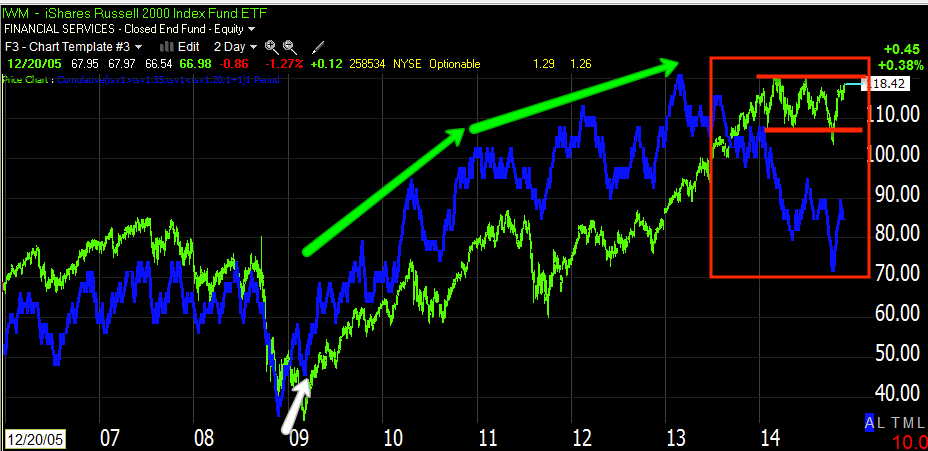
The green arrows shows near perfect confirmation of price. There were large divergences all along the way, just not large enough to reach a 2-day chart, thus any divergence on a chart this long, shows HUGR underlying flow of funds.
At 2013-2014 the negative divegrence is clear and the IWM has been essentially flat all year. I can't count how many times the Russell 2000 has closed red for the year over the past 7 months or so, it's a large, flat range/top while the SPX is a broadening top.


Note 3C is at a near leading new low as price approaches new highs, the worst divergence of the year.


Since, this one has gone negative too in to this week.

The current signal like all others is leading negative.
This market has done everything from the shakeout to the upside, the head fake above the Broadening Top, all of the negative divergences, SKEW rising, breadth falling apart, and VIX accumulated.
We are beyond the point of a break because historically we've never seen such bad divergences and dislocations which fits with what I said BEFORE the October rally even started. "That we'd have an incredibly strong rally meant to change sentiment followed by an even stronger decline to a new low below the October low", so far everything has happened and the signals are off the chart so to speak.


No comments:
Post a Comment