Since the lovely Andrea will be gone for a few days, I'm going to cook her dinner as she leaves early tomorrow morning. Being that I have the weekend with not much going on, I'll update the Daily Wrap as well as Trade Set-up/Ideas.
However you should know that as of our April 2nd market forecast which was for a head fake (failed breakout) above all of the triangles that were in the market at the time such as this AAPL which was used as an example and proxy for the broad market...
AAPL's triangle with the April 2nd forecast for a breakout above the triangle's apex in what would be revealed as a false breakout and lead to the next pivot, a larger primary leg down, likely moving toward and below the October lows (not all at once of course).
So far the forecast has been right on.
We also saw triangles in other assets and averages, some where symmetrical, some were 90 degree like this ascending triangle in the SPX. You can see our April 2nd forecast date in yellow and the breakout above the triangle's apex finally just the last 2-days.
Or the NASDAQ 100 with a descending 90 degree triangle. The April 2nd forecast date in yellow and the breakout and what I consider to be a valid, official head fake move,
this is what I said was missing in yesterday's Daily Wrap, the emotional component which forced a short squeeze as seen in an earlier post today-THAT'S THE POINT OF A HEAD FAKE MOVE, TO MOVE EMOTION AND CREATE MOVEMENT IN THE MARKET SUCH AS RETAIL CHASING, WHO DO YOU THINK IS SELLING TO THEM?
In any case, I laid out the 3 different indications I'd be looking for to tell us when this move was coming to an end as a head fake move it was expected to fail the same day the upside forecast was made, April 2nd as probabilities of long term charts showed us that any upside move was almost certainly going to be aggressively sold in to.
The 3 elements were the 3C charts of the averages going negative, specifically out to at least 15 min charts and/or longer.
The Leading Indicators to give a clear dislocated/negative signal vs the SPX
And Index Futures going negative from 7 mins to 15 mins.
As of tonight...Leading Indicators are where they were expected to be almost a month in advance...
The custom indicator SPX:RUT Ratio and it's
failure to confirm the SPX in green.
On a longer trend basis since 4/2, note the leading positive divergence in the indicator in to a "W" base in the SPX, this was part of the analysis that led to the April 2nd forecast. However,
since then, this indicator that has been exceptionally accurate for us has had a total failure to confirm the SPX above, THIS IS THE KIND OF LEADING NEGATIVE INDICATION I WAS LOOKING FOR AS DEFINED NEARLY A MONTH AGO.
HIGH YIELD CREDIT WHICH WAS SUPPORTIVE OF THE MARKET, recently has seen horrible 3C negative divergences suggesting ti would start to fall apart and act as a leading negative signal, as you can see, it has diverged from the SPX as well.
Index Futures...
For the first time in a month,
EVERY TIMEFRAME IN ES SPX FUTURES IS NEGATIVE, A "FULL HOUSE".
Again, EXACTLY what I was looking for....
And the averages...
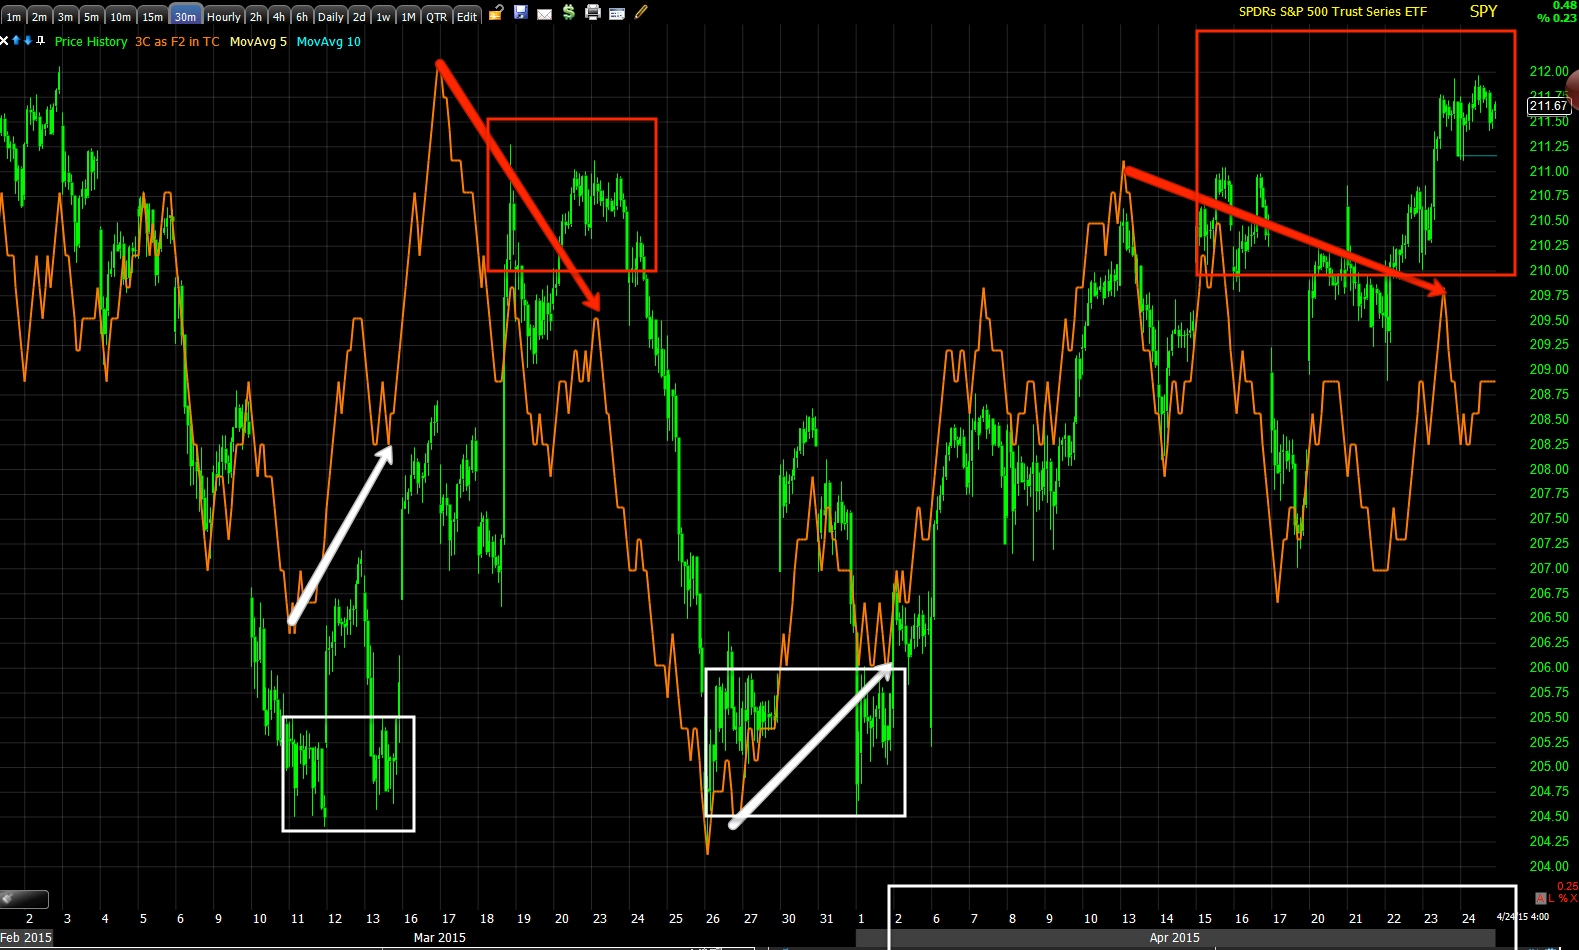
SPY with the April 2nd forecast and trend since in white on the time axis with 3C showing a large negative divergence. Note the positive divergence going in to early April like our Leading Indicator above showed at the exact same "W" bottom.
For the first time in almost a month, EVERYTHING I have been expecting to see on this move including the move itself and head fake as seen in the NASDAQ today, has occurred, I have no reason to believe that the rest of our forecast leading to the next leg won't be equally as accurate.
Have a great weekend and I'll see you soon.


No comments:
Post a Comment