Showing posts sorted by relevance for query orcl trade. Sort by date Show all posts

Monday, May 7, 2012

Did Someone Follow the ORCL Short Trade Idea?

ORCL was a short trade idea from the end of March (this link is a search for ORCL and as you'll see there were numerous updates on the trade at the end of March). This trade idea started in the middle of March, I haven't been able to read all the updates, but the March 22nd looks like a good one as it shows the March 20th post, what we were looking for to happen to enter and then 1 day later we got exactly what we wanted-LET THE TRADE COME TO YOU!

 This is the area where we wanted to see the trade move to so we could enter a short position on strength, but also a head fake move and where the trade is now. However, the trade has a lot more potential than this.

 On a weekly chart there's a preceding uptrend and then a large right angle triangle. Triangle's this big (see BIDU) are almost never consolidations and almost always either tops or bottoms depending on the preceding trend, with a preceding uptrend this would be considered a top. The price pattern implied target is around $14 or about half of where price is now.

 During March we were looking for signs of this counter trend flag-like rally to give us an entry signal. On March 20th in an update I wrote about the level of resistance at the yellow trendline specifically saying,

"ORCL is lingering at last support, so again, at important technical levels, the breaks are never as clean in the real world as they are in the T.A. books and seminars.

The 2 day Trend Channel does a good job in holding ORCL's moves, however, if they run a shakeout and this is just experience and gut, I have no evidence, then near the Trend Channel stop out (on a closing basis), there is a very juicy looking level of resistance, a break through that (at the yellow trendline) would almost certainly shakeout shorts. This is why I prefer wide stops on initial positions, it would be a shame to get booted from a good short on a shakeout move. Just be aware of the area and remember psychology, the market is about fear and greed, the more powerful a shakeout or head fake move, the more it moves emotions which for too many traders dictate decisions." 


This is an excellent head fake move, you can clearly see it was so obvious that it was predicted the day before. What made it obvious? First the flag-like uptrend had to end, second ORCL was starting to move toward breaking the channel, third the area of resistance was so well defined that traders in ORCL wold have set orders and stops there making it almost certain it would be hit. Remember when you place any kind of limit or stop order with your broker, everyone on Wall Street can see it, that is why I use market orders to execute the trade right away without giving Wall Street a head's up of my intensions, it may not matter in a big stock like ORCL, but in smaller stocks it does and when short term trading it does. The main point is so many traders using these orders would have made the area very obvious and an easy target for Wall St. to shakeout and trigger orders that would later be at a loss.


 We already knew that Money Stream had confirmed the distribution in the top pattern so entering the trade and managing it were all that were left to do.

 On the 30 min 3C chart every attempt to rally was distributed, the yellow box is that head fake move above.

 The 5 min chart shows the head fake move clearly, it's the price area sticking straight up, again, all price strength has been sold in to.

 Here's the most recent decline in ORCL on a clear negative divergence, there's also a relative positive divergence so if you missed the trade, it may come back to you allowing you to enter or add to it on some price strength.

Since ORCL is still technically in the top, it is very volatile, I would use at least this 5 day Trend Channel as a stop and maybe even give it some extra room. The bottom line is I wouldn't want to get stopped out of an excellent looking long term trade because I too too many shares with too tight of a stop. You can always add as the trade moves in your favor. For those of you who haven't already read my article from Trade-Guild.net (my free site), check this one out: How to Make More Than 100% in a Short


Tuesday, March 20, 2012

ORCL Follow Up

ORCL is in a similar situation to WMT as a short trade idea...

 Here's ORCL's Top and a bear flag that failed to reach the upper trend line. ORCL is different then WMT as ORCL is near the bottom of the bear flag rather then the top.

 Here's ORCL breaking below the bottom, if you follow the Edwards and McGee Technical Analysis dogma, then ORCL was a short yesterday and would have been covered yesterday as well, the market understand technical analysis all too well and uses it against technical traders every day like what you see here. ORCL is still an excellent short in my opinion, at least for an initial move to the large descending triangle's lower trendline, (it will probably see volatility there and then make for an even better short). So ORCL is lingering at last support, so again, at important technical levels, the breaks are never as clean in the real world as they are in the T.A. books and seminars.

 The 2 day Trend Channel does a good job in holding ORCL's moves, however, if they run a shakeout and this is just experience and gut, I have no evidence, then near the Trend Channel stop out (on a closing basis), there is a very juicy looking level of resistance, a break through that (at the yellow trendline) would almost certainly shakeout shorts. This is why I prefer wide stops on initial positions, it would be a shame to get booted from a good short on a shakeout move. Just be aware of the area and remember psychology, the market is about fear and greed, the more powerful a shakeout or head fake move, the more it moves emotions which for too many traders dictate decisions.

 The 60 min ORCL chart is ugly, this should easily move to the lower Triangle trendline and after some volatility, much lower.

The daily chart is showing the same negative divergences as well, except this time ORCL wasn't strong enough to make it to the top trend line of the top pattern.

Tuesday, March 13, 2012

ORCL Trade Idea (Short)

There are a number of different ways to play this idea, from short term trades to longer term trade, options, straight equity shorts, etc. The reason why is it appears to be a long term top that is near completion, but there are also shorter term components of it that look as if they are close to moving. Lets take a look at it first.


 ORCL on a 5 day chart, you can see a long term up trend and what appears to be a descending triangle top, a very large one, but about the right size for the trend.


 On a daily chart you can see how big the top is, ORCL not making up to the top trend line on this recent move (and I don't think it will make it there, is a sign of weakness, it's most often seen a sell signal in broadening tops after at least 5 points of contact with the trend lines, which we have exactly 5 points of contact. There was also a recent very strong gap down on big volume that found support at the bottom of the pattern for a bounce.

 Here's that bounce in a channel.

 For perspective, I drew some trendlines on this 60 min chart representing the top pattern. You can see the accumulation periods have been much smaller then the distribution periods, remember, Wall Street wants to sell in to strength, they need those bounces to do that.

 Here's a closer look on a 30 min chart,  just like the 60, the 30 min chart is recently negative in the channel.

 The 15 min chart is also leading negative, while there's a chance ORCL tries to break above the recent lateral movement of the last week or so, I doubt it would be able to hold very long. Furthermore, I have some doubt as to whether it can even make that move, the broad market will have a lot of influence on that outcome.

 The 5 min chart shows this gap up as unsupported...

As does the 2 min and the 1 min below.

There are several ways to play this, a move back inside the gap would be one potential set up, a move below the channel would be another or if it can manage it, a move to the recent lateral range would set up a beautiful trade, but again I have doubts about it being able to do that.

As usual, I would prefer initially a wider stop with fewer shares, but it depends on how you are looking to play it. I'll set some price alerts and keep an eye on this and update any set ups that form.

Thursday, March 22, 2012

ORCL Trade Follow Up

ORCL is still in good position for a short. My update of March 20th can be found here. In that update I said,

"ORCL is lingering at last support, so again, at important technical levels, the breaks are never as clean in the real world as they are in the T.A. books and seminars.

The 2 day Trend Channel does a good job in holding ORCL's moves, however, if they run a shakeout and this is just experience and gut, I have no evidence, then near the Trend Channel stop out (on a closing basis), there is a very juicy looking level of resistance, a break through that (at the yellow trendline) would almost certainly shakeout shorts. This is why I prefer wide stops on initial positions, it would be a shame to get booted from a good short on a shakeout move. Just be aware of the area and remember psychology, the market is about fear and greed, the more powerful a shakeout or head fake move, the more it moves emotions which for too many traders dictate decisions."

Here's the ORCL chart 

The white arrow is the March 20th post as ORCL lingered around the bottom of the bear flag, the yellow trendline is the area mentioned above and yesterday was the shakeout. Usually the last thing we see before a reversal is a good head fake move like yesterday's so I still like ORCL and it hasn't moved so far from a reasonable risk management position.


Monday, March 19, 2012

ORCL Follow Up

ORCL was a trade idea (short) from March 13th. ORCL has poped off several alerts this a.m., this is kind of a similar situation like we see in WMT.

 Here's the long term daily chart and what I believe is a large descending triangle top.

 Note there is a bear flag breakdown and ORCL has not been able to make it to the top resistance trendline, often a sign of weakness, especially useful in broadening tops after 5 points of contact with the trend lines.

 ORCL today is just below the bear flag, there could still be some volatility on the break of the flag's support, but ORCL looks like it's falling apart here.

 The 60 min chart of the bear flag has been leading negative  since about the time ORCL popped out of the bear flag on a shakeout move.

Here's the more recent 15 min chart showing a leading negative divergence, so it's no surprise ORCL is where it is.

Email me if you need stops for ORCL, obviously there are several different length trades one could take considering we still have the top's support below.

Wednesday, March 20, 2013

ORCL Looks Worse Than You Might Think

I haven't seen all the particulars, but it seems ORCL's earnings were a disaster, missing on  multiple business levels that they had just guided on recently.

In any case, I have some charts, it's definitely a "Put it on the radar" asset because we don't want to chase something like this.

We actually traded ORCL around March of last year short and appear to have had several members do very well with different trades.

 I first suspected this was one of our trades when I saw the triangle trendlines drew in as I pulled up the chart as well as a channel that is harder to see within the triangle. It looks like 2007 was going to be a top of some form until QE1 rescued the entire market early 2009, but looking at the trend since 2002 or even further back, this triangle is significant. Tops often share some relation in size vs how long the trend existed.

Volume is horrible from 2012 forward.

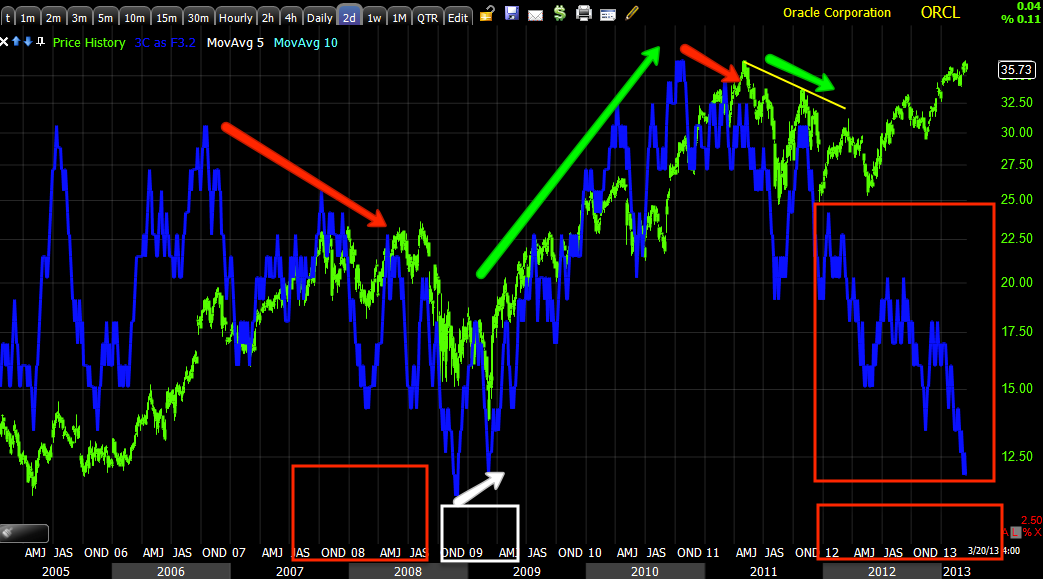
 I'm using a longer term 2 day 3C chart here which shows some distribution far left around 1990 and ORCL lost ground, then had a confirmed trend up for 7 or 8 years before red flags started showing up at the 2000 Tech Bubble top, where it once again saw distribution (also leading). One of the most obvious red flags was the upside change in volatility/trend, although it feels great when you are long, it also makes a lot of people fall in love with the stock and when it starts to fall they hold because they made so much money in ORCL in the past, they just know it's coming back. ORCL lost somewhere around 85% in the tech crash. "Changes in character lead to changes in trends" and the parabolic move up shows exactly why I don't trust them because they tend to end just as extreme and bad as they went up.

At 2002 ORCL bottomed which was the start of the new bull market that gained momentum in 2003, there's accumulation there, although it doesn't look large, it's 5 intense months and shows signs over the next two years into 2004. Obviously the 2007 distribution / top is clear as is the 2009 bottom

Green arrows are trend confirmation, ORCL had a lot of that in the 1990's. The current negative divergence is leading negative and by far the worst.

 Here's a closer look from the 2007 top to present.

 MoneyStream is a totally different form of money flow indicator, but a good one and it confirms the same as 3C on a 2-day chart, 2007 top, 2009 bottom, leading negative distribution now.

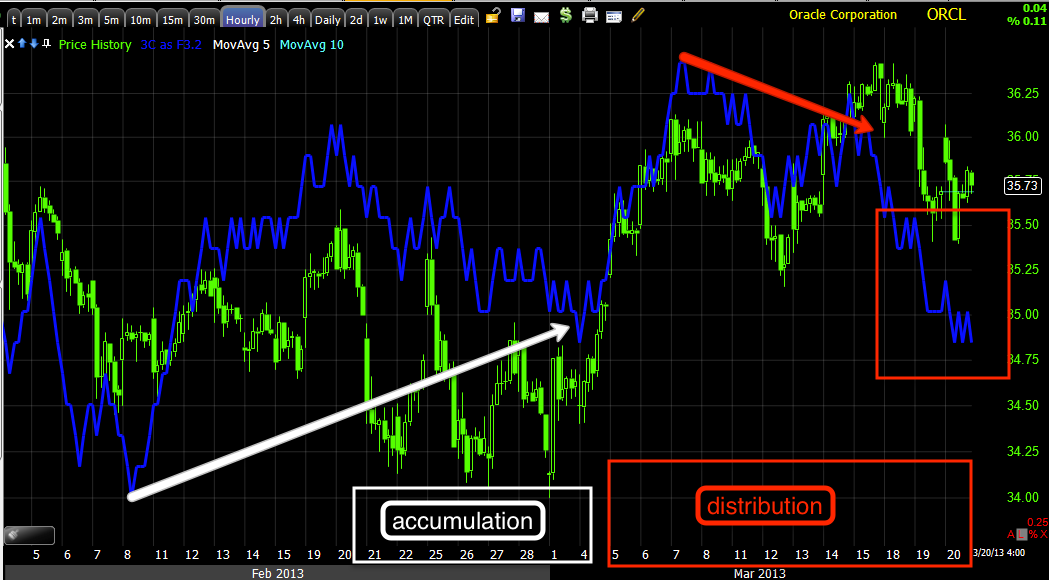
Here's an hourly chart showing what we often see before a stock breaks hard, accumulation that serves to lift the stock and then distribution in to higher prices and demand.

When I was capturing the charts I wasn't sure if we traded this one, I looked and we did.

There are numerous posts on it, but march 20th of 2012 there was a post showing what we were looking for to happen,

"if they run a shakeout and this is just experience and gut, I have no evidence, then near the Trend Channel stop out (on a closing basis), there is a very juicy looking level of resistance, a break through that (at the yellow trendline) would almost certainly shakeout shorts. This is why I prefer wide stops on initial positions, it would be a shame to get booted from a good short on a shakeout move. Just be aware of the area and remember psychology, the market is about fear and greed, the more powerful a shakeout or head fake move, the more it moves emotions which for too many traders dictate decisions."

The chart and juicy shakeout level?

 This was the area we were watching for a set up...

This is the juicy level and entry on a head fake move that completed that same day, beautiful entry. The trade lasted until May.


ORCL has much bigger problems that I think most understand with that level of distribution, it's the worst divergence in multiple decades. 

Wednesday, March 14, 2012

ORCL Follow Up

Yesterday I presented ORCL as a trade idea (short), the post can be found here.

Like PCLN and RIMM, ORCL didn't do much of anything yesterday, it's moving today.

 Here's the long term top as a reminder...

 And here's the channel that had several options for different trade entries in yesterday's post.

 ORCL is moving down and moving in to the gap, the gap is also near the bottom of the uptrend channel, note in the red area ORCL did not move with the market yesterday (one of those breadth incidents). I take that lack of participation as weakness in the stock, but again, see yesterday's idea for more details.

 Here is ORCL moving down and in line or trend confirmation.

The 2 min chart is leading and looks worse. See yesterday's post for all of the charts.

Thursday, March 21, 2013

GOOG Update

Although the case for a GOOG bounce  (which is only the minor part of the story as I'm looking for a bounce to short in to or add to shorts) is not as strong as it was several days ago as it has suffered some damage to its charts, there are still enough to suggest it's the highest near term probability.

I'm not changing anything with the GOOG April Put position as I don't see that as being in any trouble from a bounce, in fact it would likely help the Put situation with a bigger, faster move to the downside and the GOOG equity short stays in place, although I'd like to add to that at higher prices if possible.

 The trendlines in the immediate vicinity that matter, the up trend is already broken so is the minor head fake level, it's the $775 level where things get ugly. I'm hoping to see GOOG somewhere in the $825+ area, however I would NOT trade GOOG long, while probabilities are one thing, high probabilities are the only trades I want to take.

 GOOG 5 min positive

 10 min with a relative positive moving to a stronger slightly leading positive

 Basically the same on the 15 min as the 10-min above.

 However this is the trade I'm looking at, the hourly chart deeply leading negative so any chance to sell / short in to price strength in my view, is an absolute gift and this is where the high probability trade is.

The 4 hour chart just confirms how bas the situation is, this could drop like ORCL, the point is fear is picking up, I doubt it's a slow reversal and rend down, when fear hits, it hits hard. Fear is by far the most powerful emotion in the market.

Monday, November 1, 2010

Lessons Learned and Re-Learned on My Cruise

The title of the post will be expanded on at the bottom of the post-don't miss it.


It seems like the front runners got caught this time as I mentioned earlier with a high accepted to submitted ratio on the POMO today (see earlier comments today). The Dow gave up a $123 points today. I think you have to keep an eye on the ratio, today which was pretty high compared to recent POMO days, this gives you some insight into how the day will unfold as retail and Primary dealers frontrun the operations, it was about the same time POMO ended that the market started its decent.

However, someone seemed to know something as I showed earlier, the selling started right from the gap up this a.m.

I warned last week to keep an eye on the nature of forthcoming POMO days as we go all the way back to the Columbus Day Yellen speech warning the “runch bowl may be taken away” from asset classes that are essentially forming bubbles, this would arguably mean in part, equities, certainly some commodities.

The ISM number today was also not the good news the bulls had hoped for although Yahoo Finance, seemingly totally misunderstands what it is that the Fed needs to see to get aggressive on QE2, which is bad economic numbers. Today, as usual was one piece of the puzzle, but one report does not make a trend, just pointing out the seeming uselessness of some of these articles.

The real pain in the ISM report for those who looked at it came in the form of inventoried which were down -1.7%, this is where, in large part the 2009 GDP beat came from. So this was the non-silver lining in the report , which otherwise, was a headline grabber of bullish proportions.

However, we don't need to even read the reports if you are looking for a sign of the times in the economy, I found this story particularly enlightening on just how bad things are on main street and just how white-washed all these initial reports are (later of course most are revised down to the actual number).Another example is the U3 unemployment data which is significantly lower then the real joblessness or hurt being felt on the street. So THIS STORY  out of Indiana kind of give you the flavor of the real economy when unemployment offices across the state have to resort to armed guards as people run out of extended U.E. Benefits-look for them in the U6 number if you can find it in the mainstream press.

On market cash flow we have a couple of different stories, one from Bloomberg which shows that insiders AGAIN were selling in what is probably record numbers this week at a ratio which is about double what we saw last week-423:1, but the close to if not record was in the amount of $662 million dollars of insider stock last week in the S&P components and again ORCL was at the top of the list. As I have said numerous times, there are a lot of reasons insiders sell, but “my company's stock is going much higher” is not one of them. We saw this same behavior before the tech bubble imploded.

Here's another story on insider selling from MarketWatch 

Keep in mind the first is S&P stocks. The article is worth a read. This has nothing to do with mutual fund inflows, this is insider selling so lets not confuse the two.

We also got the numbers on the short interest out there and while there was a decrease of approximately 2% from $14.3 billion dollars to about $14 billion dollars, still this shows the shorts, most of which tend to be hedge funds, refuse to capitulate, even into higher prices.

Currency...
As the market has an on again/off again, but mostly on again relationship with currencies, it's important to note that the Euro was back under pressure today as the USD gained. Remember that H&S top that's still in effect in the Euro as we are pretty much in what would be the right shoulder coming down off the right side headed for the neckline. As of now, the EUR/USD pair has given up the gains it started this week's trading with.

The Dollar Index gained on the ISM report, but also trouble brewing in Ireland as reports that the ECB has sent an estimated EUR 260bln to Ireland to help its economy, which is on a rocky path again. Apparently there is an opinion that this won't be the last time either, so the Euro-zone is again facing more trouble, thus another link as to why the Euro was beaten up today.

As for the market...
I know there's been a lot of frustration with the recent trading range, up a day, down a day, or just unchanged with intraday volatility, such as today's rather high. As mentioned earlier today, I would normally think that the market is waiting out uncertainty regarding the US mid-term elections tomorrow, however it's hard to make an argument that a Republican sweep is not already priced into the market. Gridlock is usually a god thing, but in an economy that faces hard choices that need to be made, I'm not sure how the market feels about it yet. Hopefully we'll see some signs tomorrow during market hours, but most likely we won't see much until the returns are complete Wednesday unless it becomes clear very early that a sweep is inevitable. Then we may see some movement. As I said before I left on my cruise, if you are uncomfortable with your exposure in the market, please read the risk management article and make sure your position sizing fits with your risk tolerance or your version of the 2% rule that is laid out in the article.

Individual stocks....
Don't forget to look at the stocks I listed intraday, STI (Suntrust Bank) was listed just before the JPM news came out that tok the financial sector and a large part of the market down with it. I've been talking a lot lately about names like JPM and BAC and today STI-all of which I feel will underperform badly and could lead to some really nice trending trades as BAC is now.

Here's the bounce in BAC I mentioned several times last week


Note the diminishing volume

and here's the Trend Channel for a trending trade showing a large part of the decline already captured and the stock in no immediate danger of stopping out. As a mater of fact, so long as it does not close above the upper channel, I'd like to short BAC as high as possible.

You can see the channel has caught BAC's decline from anywhere from $19 or so down to the current $11.50-that's a nice trend, a nice gain, especially if you use the profits of a true short to pyramid the position.

So JPM and STI are two others we want to keep an eye on or look at starting a position in either as I talked about earlier today. FHN of course I another to put on the list, looking for a good entry set up.


A small bounce might just offer that setup. However, this one could certainly see downside follow through.

Here's a possible intraday (maybe more) bounce I see that looks to be setting up in Natural Gas as it took it on the chin today-


Note 3C showing the negative divergence at the downside reversal and now a little accumulation on this 5-min chart. It may make for a nice 1-2 day trade.

Here's AMZN which looks like a possible false move on the daily 3C chart. I personally would like to be looking at shorting this one under the gap where the white line is, but 3C daily certainly did not confirm the new highs.


PCLN is another market darling that may have just staged a head fake to the upside with no 3C daily confirmation

Here's PCLN 's intraday chart-5 min 3C

You can clearly see the accumulation leading up to Friday's move and the negative divergence at today's open. This is another to watch if the POMO game changes as these in my opinion will be taken down the hardest.

FAZ is one I've been talking about for a few weeks and it's held suport very well. I believe the current levels, which are just below a technical breakout can offer a good risk/reward trade.


HIG , as mentioned earlier today looks like it's getting ready to resume its downtrend as t broke the large bear flag today on an increase in volume. There's probably still a little room for this one to bounce a bit, this is why I prefer to phase into positions, get a little so if it continues to break from here you have your toes wet, if it bounces and stays in good technical form (on the short side) you can add to it for a better average entry. Before entering the trade though, you need to figure out your risk management and how big you ultimately want the position so you don't violate your version of the 2% rule or whatever risk management you prefer. I always like to look at my risk before any potential reward.

Others in this sector to take a look at include PRU and MET. PRU I'd look at filing out a position as it breaks support, MET looks a lot like HIG and therefore my plan would be very similar.

PWER is another that I might want to start a position in just in case a follow through move drops this like a rock. However, in the event of an oversold bounce, I'd like to be positioned closer to the red trend-line I've drawn on the chart. This stock looks like it's in real trouble here.


On the long side, PCP is hard to make a bearish case against, this is a pretty clean consolidation pattern after a run up with volume confirming as well as MACD.


If I had my way, I'd prefer to buy it around the blue 22 day moving average, although this is another you could build a position in. The red VWAP would probably be my stop or if RSI 22 crossed below 50. Being that it is a fairly obvious pattern, the stop in my mind should be wider initially (take on less shares-you can always add) just because we know the black box systems play games with obvious patterns like this. Personally I'd also probably cut my risk in half on this one as it is a maturing trend, but seems like it still has the opportunity to continue higher as the technicals all seems to be in good shape.

Given what happened to Ambac today, I'd be keeping a close eye on MBI as they are basically in the same line of business.


As you can see, MBI had a great looking 3C chart of confirmation until recently when it made a negative divergence at it's highs. This is one I'd definitely be keeping close tabs on. It's hard to recommend an entry as a “great set up” is not yet present. Sometimes, if you believe in the trade, you just jump in with good risk management. I do suspect though that MBI will be facing some of the same challenges as ABK.PMI is worth throwing in with the group as well. It's all just a matter of a high probability entry or the tactic of your choice. Many times with this kind of momentum, you don't get that bounce that lowers your risk and they just continue down. If I really like the trade, I realize that the best ones just don't come back and I use pretty strict risk management and sometimes take more then one stab at the entry until I get the position I want.

Another stock I like, JNY is a pretty H&S top on this 5 day chart-look at MACD!


There's a couple of setups here or combinations of each.

The first would be to try to get in on a bounce in the red box, the second which is safer is to wait for a break of the neckline which I would say IS coming with a chart this nice.

Well it's pretty obvious what the big event tomorrow will be. The reaction of the market, not so obvious yet, but I'll be watching for signs of “tells”.

Quickly I'll tell you my cruise was not what I anticipated with regard to posting, I could not even open my charting, much less update it and this after paying more then what I pay for a month's internet service on a very high speed connection for one hour of super slow speed that seems to be meant for checking email at best. I was going to go on about the car battery being dead in the cruise terminal parking lot and about 10 other things, but I really shouldn't be complaining about a nice little break.

In any case, one thing I did want to share with you is the concept of risk management as I laid out in the linked artile I wrote on this site. I did really well in the casino playing poker, but only when I wasn't being rushed or hurried around. The point is, when I played, I got in the game, I had a lot of loosing hands, but then a few big winners put me up considerably-as long as I was patient and didn't bet too big until I got those winners. Then I started betting bigger. Any time my pot came back to break even I lowered my risk again and waited out those big winners that allow me to bet bigger-I ended up making about 50%-although I didn't spend much more then a few hours in the casino. The point being, RISK MANAGEMENT-get the winners under your belt, get on the right side of the game before you start swinging for the fences. The fastest way to lose everything was to be down significantly-lose patience and start betting big to try to “DIG YOURSELF OUT OF A HOLE”. Like I said in the article, “When you're in a hole, stop digging!” The game and the market are all about patience and risk management-THAT'S IT! That's the big secret. It is not about doubling down on a loser.