Wednesday, June 30, 2010

Still have a positive divergence

The divergence is there, that is not really the concern, the market can go up, but it would be best for us if this inverse H&S is not broken to the upside. It's not the end of the world if it does, just more time and possibly some extra action we may have to take.

Update 2

We have a minor 1-min positive divergence, but in the long run, it's looking pretty negative.

Small H&S bottom

There's a small (1 min) H&S base, but the volume is wrong for the pattern, in any case, a break above the neckline at $104.90 would signal a run higher to the gap area.

this is one of 4 3c type indicators that is positive, we also have one now in a leading negative divergence, explanation=watch price for that break above, if it totally fails, we should see a quick move down.

The indy above is inline on the 5 min SPY, negative on the 1 min QQQQ and positive on the 1-min DOW, all other 3C's are mostly in line to slightly negative on the 5 min charts of all 3 averages and slightly to very negative on the 1 min chart. This is what I hate, a lack on confirmation, but that is what is there and like I said, it's a lot of retail trading now so the readings aren't terribly important yet.

UPDATE

The 1-min positive divergence we saw yesterday is already fulfilled in filing the gap this am and it's slightly negative now, but hasn't gone into a leading divergence, if that happens then I'll post that chart as it would be meaningful.

There are a few 1 min charts that are starting to deteriorate, the 5-min did not gain any ground on the fill of the gap and instead is relatively negative. Thus far, although it's way too early, I don't see anything very bullish so watch for more downside. (1) 1-min 3C is close to a leading downside divergence, but until it is leading, it can turn up any time, but still it's fairly negative, more so then I expected last night.

Tuesday, June 29, 2010

Tomorrow

Take a look at the charts on Trade Guild tonight. As I said, we have an important day in the books today, if we get follow through, I'd say the market's fate is sealed and you won't have to do much other than manage your positions, take in money and play some counter trend moves. The whole point of the CORE positions was to get the work done early, then you'll be able to sit back and reap the returns. We are not 100% at that point yet.

The positive divergences are not surprising. Whatever changed today did it fast and in a big way. Market makers got nailed as they saw the gap, they also saw inventory at much higher levels go into a huge loss, especially after they had been gearing up for an oversold bounce. So don't be surprised to see an attempt to fill in that gap; this is why we don't make decisions based on intraday moves, but rather the close.

Also do not be quick to panic, this would be a very normal occurrence and even though it may lead to some upside, it's not highly likely to. Even if it does, we already know where this market is headed, the only thing that will change is a few tactical decisions to reduce drawdown and protect our positions.

Be patient, be calm and make sure you have 25% or so in cash. If you have questions, feel free to email me. If you have time to watch the market tomorrow, you can probably make a quick buck buying something like UPRO and holding for the a.m. bounce, unless it turns out it should be held longer. In any case, that position could probably generate a nice little gain in the a.m.

By the way, the internals today were astoundingly bad. There was no hiding what  money was doing today and it was borderline panic.

Congratulations!

I must say, whatever "really" triggered today, I didn't see it coming, I believe Wall Street did not either. The one min divergence that was very unclear last night was the head leading the body. The 5-min and longer positive divergences were like the tail which takes a little longer to turn, but just as we saw a positive divergence develop quickly, we saw it deconstructed equally as quick, maybe even faster. Smart money reserves the right to change their mind and today and late yesterday, it appears they did exactly that.

Today, with an exception or two, 3C did not find hidden accumulation or distribution, it tracked pure, open distribution and worked as a confirming indicator. The selling was not hidden it was plain as day, right in the sunlight. Something big appears to have changed and if you watch TV or read websites everyone will have a reason why. We have known for months that this market's fate was already sealed, this is why we strategically built up our "CORE" short positions. Let me warn you though, all of the reasons you will hear tonight about why the market did what it did are probably almost all wrong. It will become apparent at some point in time why today specifically acted as it did, but by the time the truth of it comes out, it will be too late for the late-comers to act on.

It really doesn't matter why today was the day that our downside trigger was pulled, we've known for months through charts like this that institutional money was planning for this day.


Although I'm proud of you guys and today was a big day, WE CAN NOT GET TO AHEAD OF OURSELVES. The truth is, the S&P carries the most weight, it closed below the H&S neckline which creates massive overhead supply / resistance. However, the DOW did not break today. The Q's took out the neckline lows, but they didn't take out the 5/6 lows. The IWM has not taken out the June intraday lows, we still have some doubts as to the move, although if there's an index you want to see break, it's the S&P and it did so.

Tomorrow we will see if we get follow through, if so then we are well on our way to a profitable quarter and then some. If we see a bounce, we'll play it by ear and hedge appropriately when needed, that is why we left at least 25% in cash.
As you can see below, we have a 1 min positive divergence, so I'm expecting some upside tomorrow, how far that reaches remains to be seen. What I do feel very strongly is if it isn't today, it will be very soon.

Lets wait and see what happens tomorrow.

Looks like time to fulfill our plan

Unless there's a monster rally in the next 10 minutes, you should go ahead with our plans and expand your short positions. Volume picked up as $104 (SPY) was broken. Most of the divergences deteriorated into confirmation. This is the analysis we've been planning for months, this is what we have been waiting for. I think you can move forward and load up the rest of the shorts. Make sure you do not go into a portfolio leveraged situation and have at least 25% in cash.

I'll update tonight, but this is what we have been waiting for... GO!

Correction of the last post

We only want to add the shorts with an SPY close BELOW $104.30

Here's why we are waiting

The 1 min has gone positive, the 5 min has been positive, so we ar watching for late day strength, we only want to add the rest of our short position (bring us to the 75% short area) if the SPY CLOSES above $104.30, otherwise this may be another volatility false breakout. Don't worry if you miss a few points waiting, it greatly enhances your risk / reward relationship

Update

We are under our trigger, try to wait until the close (as close as possible to the close), if we are under the trigger or $104.30 go ahead and fill out the short positions using either shorts listed or the core positions mentioned earlier today. We want to wait a bit and see if the late day rally materializes, if not, then we complete our top plan.

Update

As of now, the 1-min hasn't showed any real divergences other than the one I mentioned earlier, for the most part it has been in lock step confirming today's price trend, however, the 5-min chart fell and quickly recovered in 4/5 charts. As I said last night, I was looking for strength later in the day, so it appears that is what we have as of now. I will continue to update, we should get a 1-min positive divergence before any move up, when it appears or "if", I'll let you know.

Update

It's way too early to say, I have to admit the size of the gap may is big and this may not be the best time to update a it may be effecting my analysis as we're still somewhat blind. The 5 min is moving down, which is expected, it's not in a negative stance yet, but could be. It looks like a very short term bounce is brewing. The trend could continue down after that, this is why I want to wait until late a.m. to decide with more clarity. But you may want to take advantage of any short term move up to reposition anything you may want to.

Clear my Eyes

It's always interesting to wake up, see a huge gap on the charts and keep rubbing your eyes until you are convinced what you thought you saw is really there.

I said last night that I didn't think we'd see strength in the a.m., but this is a whole different ball of wax we are looking at. This is why I had an ambiguous tone last night to my charts and analysis here and at Trade Guild, not because I foresaw something like this, simply because in the short term, I had no visibility whatsoever. That can happen for a couple for reasons, one of them can include as I mentioned last night, the Byrd passing may have totally changed the game, I didn't think so, I'm inclined to not think so, but maybe it did. In that case, if that is what happened, then Wall street is deconstructing the position they took last week as fast as they put it together, thus we have short timeframes following them in the other direction and the longer ones are like a tail or a ship with momentum, it takes them longer to turn.

Another scenario.... we are back to the crazed volatility game in which we see a huge gap down and then a rally back up, this would be one of the bigger volatility moves we've seen and we've seen some big ones.

The final scenario is kind of the same as the first (although there really is no end to the scenarios), the market is not bluffing and this market is ready to move down. In this case, we do the same as we have been planning on doing since we established the core short positions which are on the list 6/3/2010. We are at 50% of portfolio in these positions, (if you have been around awhile, were bought long before 6/3 at much better pricing) but the idea has been to add the final 25% and leave 25% in cash, as the market moves below the $104.40 area on the SPY. So be ready for either scenario. If you are long any stocks from yesterday, you should also have core shorts in place as those are the priority, so you should be largely hedged and not be in need of desperate action, meaning I would not just sell on this gap opening. Try to wait and see if this is a shakeout, if it continues down, then you have to do what you feel comfortable with, but if it goes below our bear trigger then be quick about adding the rest of the shorts to your position.

If visibility returns, then we'll have a good idea of which way to play this, I would guess it wouldn't be until late morning before we see what the 2 min chart will do.

Stay tuned today. Checkout any of the limit shorts that have been on the list that have not triggered as well, and even longs if they do trigger (some may).

I'll update as soon as I see something definitive.

Aren't tops fun?

Monday, June 28, 2010

Sticking to My Guns for Now

If this pans out the way I think and have advocated it will for the last several trading days, then we will have to take a look back and really learn something about Wall Street and just how far ahead of the information curve they really are. In this case, it seems the rally was based in large part on bets that a Senator would pass away before the vote on financial reform.

I'm still behind the positions listed in the last several days-Gold seems to be working out, some embers took the short on GLD a step further and made some money today on short/leveraged inverse Gold ETF's and made a nice gain in a few hours.

Today was a "nothing day" in my opinion, you can see the charts at Trade guild tonight.

I will just say for those who haven't taken positions but want to, our idea was to add some of these longs today on weakness-better pricing, better risk profile, but we don't want to get too aggressive until we see proof. What's proof? The SPY breaking above it's base around $108.50, certainly a move through gap resistance from the 23/24th of June around the $109 area, that would be enough for me to get pretty aggressive on filling out these positions.

Now the alternative to what I laid out on Trade Guild tonight is that the Byrd event changed the game, that it was an unknown. I doubt this to be true, I wouldn't be surprised if his caretakers were on the phone with Wall Street giving them updates on his health. So for now, nothing has changed yet and the plan remains the same, but we also have enough good trades there that I don't think it's wise to stretch the charts looking for more trades to fill out the list, although I did add a few to the list tonight-be careful as they are all in the same industry group, you don't want correlation, however a short and a long will work. If they aren't trades we are investing in or would invest in, I'm not listing them. Patience is your edge over Wall Street, it's a tough edge to take advantage of. Emotionally and logically we have the idea in our heads that if we are not working or doing something, we are not making progress. This simply is not true in the markets-it's your single greatest advantage.

Another misconception is the "I have to get a 70% to pass". Not in Trading, think of it like baseball, would you be happy with a 400 batting average (40%)?  I think so. Risk management  is so very important and it allows us to have a 300-400 batting average and still double our portfolios. Get over the "I have to be right more then I'm wrong" attitude, get over the "70% is a passing grade" and get over the "I don't want to take a loss".

If you can't take a loss, while it's small, eventually you WILL take a loss that will cost you dearly. This isn't about being right, it's about making money. So for now, observe, watch the markets, be ready to act, understand that you are not in a battle of wits with Wall Street, you are in a battle for cash and you don't have to outsmart anyone or be right more than you are wrong. Like they say, "Do you want to be right or do you want to make money?" It seems like a simple question to answer, but i think we've all been in the, "I don't want to be wrong, I don't want to take this loss" camp before. your job to be a successful market participant is to retrain your thought process, rid yourself of ego, and do the things that just do not come naturally.

As for tomorrow, yesterday's trades could be pretty nice trades, I think it won't happen first thing in the morning, but you'll want to watch for updates and add at those tactical levels I laid out above.

Finally, Welcome new members, thank you to our members that continue to support team Wolf.

Have a great day, and lets see if we can't take some money from some sheep.

Update

There is nothing new, the 1 min is in line with price for the most part and the 5-min is still showing a positive divergence. At this point I still expect to see a move higher in the days ahead.

Update


Here's the 4C chart , there was a negative divergence out of the gate, but we still have a positive divergence into the lows intact. Go easy on the longs, we are adding them cautiously right now, above the open you can be more aggressive and above SPY $109 I think you can be more aggressive in adding the long positions.

From Trade Guild Today

He had a voice that was all his own, in fact, his voice was so recognizable, it was easily identified when some government eavesdropping was discovered, ease dropping on one of it's own senators. The man who went from the KKK to a tearful champion of dogs that couldn't defend themselves. There's a lot you can say about the Senator, he was an unique man.

However, this isn't political commentary. The financial reform bill that Wall Street applauded with huge bank rallies on Friday is now in jeopardry of being 1 vote short of the 60 needed to move it through the Senate. Scott Brown who initially supported the bill is now in the "toss-up" column.

I mention these things only because 3C tracks what the market is doing, however rare events like this that can not be foretold (yesterday I read he wasn't well, but I didn't get the impression he was going to pass the next day) can change the landscape very quickly. Luckily, as I posted last night, 3C can change quickly as well (it picked up a 30-min positive divergence which is substantial in a day, almost turning on a dime). I fully expected a rally, apprently fueled in some part by the financial reform bill that Wall Street seemed to like, (as I mentioned, they may have discounted the worst case scenario and it came out of conference a lot tamer than what had been discounted).

So today's 3C readings will be important to judge the viability of this rally/bounce. Keep an eye on Trade-Guild and of course members of Wolf on Wall Street (you can login from Trade-Guild) you'll see them with any analysis and actions I feel may be prudent in considering.

RIP Senator Byrd

Sunday, June 27, 2010

Up She Goes...

If you ket up with the posts late last week, you shouldn't be surprised and maybe you are even ready for a little upside rally, Friday's close and everything I see seem to indicate that's what we'll get. How high? It could build onto the right shoulder of the H&S top as they tend to be symmetrical an the right shoulder is a bit short. THIS DOES NOT CHANGE OUR BEARISH STANCE, the market simply doesn't go straight up or down and if we can hedge and make some money too, all the better.

Here are he charts that you'll see on tonight's watchlist and don't forget the other recent longs listed. See the spread sheet for more information.

Something is up in the long treasuries, this is a "W" base with great volume to confirm it. 4C is in a leading positive divergence and it looks coiled for a breakout through $100 where the volume should be enormous. The red arrow is a negative divergence and yellow are positive divergences and a leading divergence or strong accumulation.
TLT 3C 5 min chart suggesting this will breakout soon, probably tomorrow.
Here's my Trend Channel, the red arrow is the current stop on a closing basis, it has the advantage of being objective and locking in profits everyday.

I listed two other plays on the treasuries, both are low volume ETFs, UBT and TMF which are 2 and 3x leveraged respectively.

Get some financial coverage-UYG is a 2x leveraged ETF that will let you play the financials. Banks went nuts Friday. Here's a nice 10 min divergence suggesting this won't be a 1-day move but several days to a week or so.

Again, the Trend Channel. See the first red trendline was a long stop out, the yellow arrow points to the current stop level.  This one turned around fast. The banks like something in Congress's bill that is suppose to tame them down, I guess it wasn't s bad as they anticipated.

I've stayed away from gold for the most part, but this daily 3C chart has followed gold flawlessly for over a year and now it's in a negative divergence, something is up here.
GLD 1 min 4C chart, suggesting early weakness.
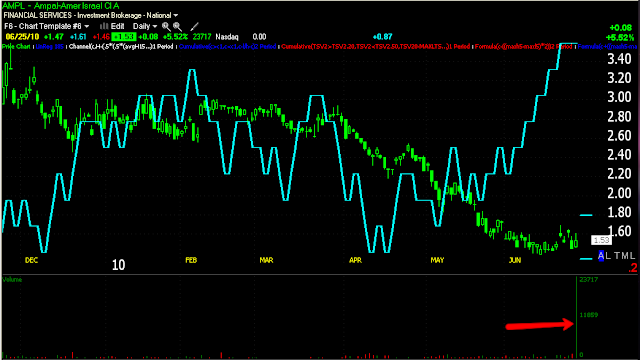
I started a new watchlist, Thursday night AMPL was the first stock I put on it, there was something I just liked about the chart-look at that volume Friday. This looks poised for a big breakout.
Great volume in the daily chart of LAB, a nice descending wedge which is bullish and a nice 4C leading divergence all suggest that this will end up higher in the weeks ahead.
IEC is a long now in my opinion, it's formed a nice little base, volume is beautiful. Note the resistance is coming from that gap back in May. Gap resistance must be watched, IT IS RELIABLE.
MBI should roll with the market, it has a nice false breakout going for it, yes I think these things are positive! Now look at the volume (orange arrow), it's rising. Volume doesn't need to club you over the head to be meaningful-watch for that which others miss! These patterns are prone to false breakouts so the stop is wide initially.
Finally, if you own just one, then UPRO, it'll give you broad market exposure at 3x leverage on the S&P. I mentioned using this ETF last week so maybe you already bought some?

OK, I would get busy buying if I hadn't already, hedge your portfolio and you'll most likely make some $$ on the run too, this is why we are at 50% in the core shorts, to leave room for these opportunities until the market really breaks, and even then we still leave 25% cash for the same reason.

Have a great week.

Friday, June 25, 2010

Another negative divergence

It looks like we will get the close I mentioned earlier as there's a negative divergence in the 1-min chart, suggesting a pullback into the close.

Pullback is coming

But the 5-min positive divergence is solid. This will probably end up as a doji day-open and close are nearly the same which is a typical reversal signal.

If you can, watch the market now

It's very interesting. I still feel we will see upside based on the 3C charts, but a late day support level at $107.14 (SPY) just got taken out, watch how the volume rises there as the stops that people place with their brokers (A BIG no-no) all get hit. This is a typical maneuver on Wall Street now-a-days, you might call it fueling up. They continue to prod the area and volume is falling off, suggesting they hit the stops there. Now is the time you might anticipate an upside reversal, but we shall see. It's interesting to watch how they operate and how the "tools" your broker provides are actually being used against you!

Remember, what does Wall Street produce in their factories to make money? NOTHING! Trading is a zero sum game, for them to make it, you have to lose it and a big group just lost it.

***Update -a second after I pressed "Post" the market put in a nice tall candle. Hmmmm....

morning update

It seems we'll get a small gap up this a.m. which leads me to believe this is a real move and not a false move as the false gaps tend to be bigger and for a reason, the market makers are using them to fade the gap to make money, a small gap doesn't show that intention.

A break above the $108.75 area on the SPY today would be a fairly definitive short term reversal. We are looking at using UPRO to hedge our shorts and ultimately make a little money on a counter trend move. Seeing as the market typical overshoots normal targets as part of it's shakeout maneuvers, I fell it is possible for a bounce to carry as high as the $112.25 area on the SPY which would be good for anyone wishing to go short the market. I do not think it will cross above $113.20 to make a new high. The target may be even lower and of course there's the possibility it just fails altogether. The financial reform legislation can not be a good thing for the market, except for giving individual investors more confidence, but they account for so little of the trading right now, I doubt it'll make a big difference at least on the upside, especially when compared to the downside of which will be marked by a lot of firms doing a lot of things to get compliant and to find new ways to skirt the bill.

Considering nearly everyone on Obama's team has spent some time on Wall Street, I imagine this is more bark than bite, but there will be consequences-mostly unintended as there always are when the government tries to do anything. It's all a moot point, just as long as we are on the right side of the trade.

If the market begins an a bounce, you can monitor it to know roughly when to get out by using a 50 bar simple moving average on the SPY on a 15 min chart, it seems to work pretty well. Usually I use the close as an indication of when to close out positions but intraday volatility may mean that intraday stops or scaling out on intraday breaches on the 50-m.a. may be more wise. Looking at past performance, even in substantial trends there will be the occasional break of the 50, but only for a little while and the trend continues. So another thing you may wish to through into the mix is the direction of the 50 bar average-as long as it is moving up, any break of it may be temporary. Typically it takes a little time to distribute positions and the 50 will usually go lateral to down at a trend change while momentary violations of the 50 may be false if they occur while the average is still trending up. This is why I advocate a possible "Scaling out" exit, but if you choose that, scale out on the first substantial sign of a break, don't wait for it to drop several percent as the strategy would make no sense at that point.

Thursday, June 24, 2010

What is a Divergence?

A divergence in 3C is simply an indication of accumulation or distribution. We try to narrow it down using multiple timeframes, but ultimately we do not know how long smart money will be accumulating or distributing, still it gives us a much greater advantage then almost any other indicator I've seen.

Read Trade-Guild tonight. You will see that there are enough divergences to the upside in enough timeframes that we should see a bounce. The trades posted last night should work fine, or you can try out some ultra/3x long ETFs, but this is only a minor move, don't be fooled by it into thinking the market has become bullish.

I listed one new inverse (short) ETF tonight I saw on Telechart. the volume is low, but it is a textbook, picture perfect setup. While the market may bounce, it may fall and make for a good entry. Do not be surprised to see a move below the lower support line of the triangle as Wall Street shakes everything before they let it move. I'll keep an eye on it, you should too. Here's the chart-oh and UNG violated the stop by a penny, it's not a big deal in my book, but much more and I'll have to re-evaluate our position there.


Watch for a market bounce as early as tomorrow.

Update 2

We now have positive and fairly substantial positive divergences in the averages. You may want a long ETF to try to make a quick 1-2 day buck

Update

While the 1-min divergence was short lived if lived at all, the 5-min divergence persists which suggests a move to the upside in the next day or two, at least as of now. I would not change anything with the core shorts, but perhaps some of the longs will pop, I will have to re-evaluate the stops and entries based on today's decline.

Any 5-min positive divergence is an indication of a retracement which is totally normal

pre market update

There are 1-min positive divergences even though it looks like we'll see a gap down. We have seen plenty of false moves to the upside that were at odds with 3C readings so don't be surprised if we see a gap that is filled. In that case we may see upside from there and last nights longs may work well today. However, if the market just goes into an early free-fall with no signs of recovery, you must be selective about the longs and see which ones are bucking the trend as they did yesterday. Again, while there may be a few positions that turn into trending trades, the majority are meant to be quick pop trades. If they advance 5-7%, there's a chance they may trend more. If they pop over 10-15%, it is more likely they will be short lived.

Wednesday, June 23, 2010

Repost from Trade guild tonight

This is a repost from Trade guild. Note the positive divergence that started quite a bit before 2:15, I wonder if the Fed is leaking too?

In any case, there may be a rally tomorrow based on the 10-min chart, or it may be just be lagging the divergence that started earlier today. If we do see a move up Thursday, then there's quite a few trades I listed tonight that are pretty speculative generally, a few could trend. The point is all of these stocks were strong in a mediocre market today. Take a look at them. Many are biotechs. Email me if you have specific questions, we are still maintaining our shorts as the market is moving in our direction, but believe it or not, there are generally more up days in a bear market then down days so if we get a pop, these stocks are likely to see more upside. these are counter trend, not trending trades. So if you get that 1-2 day gift, take it. These are not meant to be position trades, but a few do have that potential.

Here's the post from Trade guild:


First, lets deal with the business from last night and today at Wolf on Wall Street.


"As for tomorrow, the only thing I see is a slight positive divergence on the 1 min timeframe which may lead to some early strength, perhaps a gap up. As of now, All other timeframes are showing heavy distribution. I'll update the charts tomorrow as they develop, but the changes will only be tactical in my opinion, the strategic outlook is the same we have had for several months now and have already set our positions into place." Trade-Guild.net 6/22/2010 9:00 p.m.

While we did not see the early strength during market hours, we did see it pre-market. The indicator was showing someone, most probably market-makers/specialists buying a little at yesterday's close to sell into early strength, it doesn't have to happen during normal market hours and could very well have been distributed during pre-market.

If you lick on the chart, you can see 3C was very accurate again today.

As for the Fed's announcement, this is an excerpt from Wolf on Wall Street today at 10:15 a.m.

"The Fed is widely expected to leave rates unchanged, but the markets know that. What the markets are looking for is any hint that the language has changed. Even one word that most of us would miss or dismiss could be the catalyst the market is looking for to go in one direction or another.

In the past the Fed has been very willing to step in with some tidbit to halt a market's slide, like the slide we have seen the last few days, thus the Fed is known as the "Plunge Protection Team". So today is a bit of a wild card, but as far as I can see with 3C, there is not much in the way of high hopes. The markets do not look like they are i a holding pattern, they look bad and this may be part of the market's ploy of playing possum to get the Fed to move when they'd otherwise maintain course, even if it is just a few words changed in the policy statement.

"The Fed Effect"- There is a tendency for the market to react or overreact to a Fed statement the day it comes out, within a few days the market seems to have slept on it and goes in the complete opposite direction. I don't know what's in store as Fed policy announcements are not as easy to spot with 3C as are government reports and earnings. However, if you see a wild move after the Fed decision, don't be so fast to react to it, give it  day or two."


Today we did see a pretty initially aggressive upside move after the announcement and then it came back down a bit. 3C 10 min charts are indicating a retracement of the last two day's drop-

If this scenario pans out, it would not be out of character at all, typically the initial reaction to Fed policy statements is the wrong reaction and after a day or two, the market reverses. Lets assume we do see a retracement to the upside in the next day or two, it came because the Fed showed concern and was fairly strong in their language that they would hold down rates.

What would make a move up based on that statement reverse? After a day or two of sleeping on it, traders come to the realization that the Fed's econo-friendly policy statement was there because the economy is not at all in the good order that we have been hearing about for months AND.... What does the Fed have left in their arsenal? Buy more toxic loans? Lower rates that are already at 0-.25%? They don't have much left to work with and traders will realize this in fairly short order. The only bullet the Fed has left is to cut interest payments to banks holding money in reserve, then the banks may be forced to make some loans tp generate some income. Even that is not likely to avert the disaster that the government has been trying to avoid. Imagine a ship full of holes and they have all 10 fingers and 10 ten toes in a hole, but there are still multiple holes spewing water and the hull is filling up fast. That is exactly the reason we have such a big and well formed Head and Shoulders top, the market knows what is able to be held together with bubble gum and what is likely to fall apart at the seams.

So for now, we'll use any opportunities to the upside for quick trades and to sell short more stock at better prices.

Sometimes the bear just gets you, no matter how many hot dogs you throw it's way.

If you don't know what to do by now, you might consider going into cash. there are great trades out there and we have a ton of them at Wolf on Wall Street, check it out for a month and see for yourself.

Back into the Blender

The Fed's very soft and cuddly stance on the economy seems to have gone over well with traders, we have positive divergences from 1-15 minute which formed quickly. Remember my earlier warning that the initial reaction is almost always the wrong reaction. Later tonight I'll show you some charts that seem to indicate the news may have been out before it was "out".

In my view, this still changes nothing and I'll elaborate later tonight.

Update

We have seen the bounce from the 10:02 update, half of the 3C indicators are calling an end, the other half are still inline, but this was a bear flag and its target implications are for a move to the $108 area.

UNG

That was a close one, but  I hope it imparts a lesson on patience and non-emotional/objective decision making. At no time did I get emotional about the severe dip in UNG in a few days, it all made sense, nothing on the charts changed and today it's off to a healthy start and ready to take on its first reistance level at $8.25, which it just broke through as I write this. I feel it's still a decent buy here or add-to. Take a look and see if the trade is for you.

Wednesday, Fed Day

The Fed is widely expected to leave rates unchanged, but the markets know that. What the markets are looking for is any hint that the language has changed. Even one word that most of us would miss or dismiss could be the catalyst the market is looking for to go in one direction or another.

In the past the Fed has been very willing to step in with some tidbit to halt a market's slide, like the slide we have seen the last few days, thus the Fed is known as the "Plunge Protection Team". So today is a bit of a wild card, but as far as I can see with 3C, there is not much in the way of high hopes. The markets do not look like they are i a holding pattern, they look bad and this may be part of the market's ploy of playing possum to get the Fed to move when they'd otherwise maintain course, even if it is just a few words changed in the policy statement.

"The Fed Effect"- There is a tendency for the market to react or overreact to a Fed statement the day it comes out, within a few days the market seems to have slept on it and goes in the complete opposite direction. I don't know what's in store as Fed policy announcements are not as easy to spot with 3C as are government reports and earnings. However, if you see a wild move after the Fed decision, don't be so fast to react to it, give it  day or two.

Either way, we'll know around 2:15 we'll know

Small Bounce

When I say small, I mean just a small move up. Right now the market just hit a hole and went straight down, but there is a 3C  min divergence building.

Tuesday, June 22, 2010

Not much to do

If you have your shorts in place, there's not a lot to do right now other then manage the trades and take advantage of any countertrend pops we may get to make some extra cash along the way. The price action the last 2 days is significant and plays right into our core positions. It appears we will see a Head and Shoulders top unfold, s of now, the first or minimum downside target for the SPY should be $87 which makes sense on the charts. However, such downdraft is likely to bring more downside momentum and I have maintained for months now that I expect to see new lows in the averages. Remember, Fear is stronger then Greed so the market will fall a lot faster then it rallied.

The only unfinished business is UNG. The trade is precarious, but it did hold the line in the sand I drew last night. Here are  a few charts and we do have a few positive divergences suggesting upside tomorrow and that may build.

Above is the Trend Channel I use for stops, UNG held the line today which was very encouraging
This is a 2-day 3C chart and very significant in the leading upside divergence or extreme accumulation
This is a 1-dy 3C chart written with  different code, but the same leading divergence
The 15 min 3C chart suggests the downside is over as accumulation has begun again 
The 10 min chart confirms this as does the 5 min chart below.


Here is my proprietary crossover system, all 3 parts of the system still are calling this a long trade. As I mentioned, note the first pullback to the 10-day moving average in yellow and the second to the 22 day in blue, I see this time and time again. Also MACD is positive and the VWAP is in good position as the average price paid over the last 30 days weighted by volume is just above $7.50 (VWAP in red, the top window is a 10 day ma in yellow, 22 day in blue, the middle window is a custom indicator in yellow and it's moving average in blue. With MACD in white is a 22 period RSI which is above 50. All 3 components are needed to place a long position and hold it. Despite the volatility, I continue to believe in this trade. I think it is at an excellent Risk:reward level to initiate a long trade in UNG or to add to it.

Look for updates tomorrow as the market events unfold. I'll be adding selective shorts, but for the most part we already have everything we need to take advantage of the market's stance. Trades will be issued as opportunities arise, most will be quick counter trend trades, there may be some tomorrow night listed. Keep an eye on the site.

Update 2

We have 1 very minor 1 minute positive divergence, it may not amount to anything, it may be day traders covering shorts, but in any case, all the other timeframes are solidly bearish at this point. Yesterday's bearish engulfing candle is known in western terminology as a "one day key reversal" and it appears it was exactly that.

Remember that UNG's stop around $8.08 (actually below, but that is just a recommendation) is only for the end of day, not intraday. All stops found here are the same (both recommendations, not written in stone and for the end of day).

ANO

Keep an eye on ANO from last night's list, it's looking like it wants to breakout.

Update

At 10:3 I posted a chart at Trade-Guild that 3C 5min was forecasting one more move to the upside, we got that move. However, the positive divergence on the 5 min chart persists, there may be more upside coming. The longer term charts are still solidly bearish so this may be of some use in entering short positions at better pricing with less risk as they are closer to natural stop out levels.

The Gap Was Helpful

As a way of entering shorts at a better price. See Trade Guild, it looks like we'll get another upside attempt soon.

UNG has a 1 min positive divergence right now, that's about it. It could develop into more, but if it closes below the Trend Channel at $8.08, I would close the position just before the end of day. However, as I mentioned, the second pullback in a new trend is usually at the 22 day moving average which is at $7.94 (it may rise a little later today), normally the Trend Channel is inline with this concept, in this case it's a bit higher so it is not unusual to see a move to the 22 ma, you'll have to decide how you want to handle it. If I see anything that is relevant to UNG today, I will post it.

Monday, June 21, 2010

Today Was A Positive Development

First before I get into the market, I have several emails regarding UNG, I still like the trade, I'd still buy it. The stop on the trade is at $8.08 and unless it breaks that level, I consider it a long position and we are still holding it. Today it pulled back a little past the 10 day moving average, not by much though. It looked bad because it did it in a day, but it's common for the first pullback to be in that ares and the second to the 22 day, this is the second pullback, the first was exactly to the 10 day, so I do not feel that it is a problem at this point.

As for the market, you probably heard my tone last night, cautiously bearish and expecting most likely to see a false breakout, but unwilling to commit as the indicators had been turned around by Friday's options expiration. Today we got the clarity I was hoping for and then some. My fear was that Friday the S&P/SPY calls at $112 (the highest open interest) were possibly being pinned down to make them expire worthless and then there would be the possibility that they'd let the market rise after that. the market had an enormous head start on that scenario this morning and failed miserably, but as I have noted, we saw 2 false breakouts last week alone, now we have a third.

There is some early 3C divergences on the 1 minute chart suggesting early strength, again I do not feel this will lead to anything significant and it is time to start watching for the tell-tale signs of a decline as almost all of 3C timeframes have lined up in all 4 versions and in almost all timeframes in all averages on the distribution side. This is extraordinary to see, it doesn't happen often. We've had to sit through some enormous volatility and drawdown, but I do believe we are close to realizing the trend we have been preparing for.

In the meantime, despite some negative action in the miners, there remains positive accumulation in several names. I will list those long trades tonight, this is not at odds with my bearish market stance, there's always a bull market somewhere even in the middle of a bear. However, these are most probably counter trend trades and needed to be respected for the danger that they can bring in trading against a trend that is emerging so make sure not to over commit, make sure to properly position size and set a wide stop initially (take in fewer shares) to give the trade some space to work. It's not easy to short into strength and buy weakness but that is what is called for right now.

If you are a new member and are unsure of where you stand and what you might want to consider having in your portfolio, please email me and as many members will attest to, I WILL give you the support you need as best as I can as soon as I can.

At this point, unless you feel you need it, the hedging strategy discussed last night is off the table in my mind for the time being. Interestingly, every time we consider starting to hedge, the next day the market falls apart.

It looks like in the early trade, the DOW will outperform the SPY and the SPY will outperform the NASDAQ. That's based on 3C interpretation and only references the early trade, but if there are positions you are looking for, that information may be of some use.

I'm going to add a few more trades to the list tonight and it will be up shortly. Several members are past due on their memberships, I'll try to notify you and I will leave your membership open until at least tomorrow night so you can see the new trades. Because of the blogger format I can only have 100 private readers and we are nearing that number.

Update 3

It looks like there's a positive divergence building on the 1 minute chart, look for upside shortly, but the close is what will really count. I'll update again before the close if I see anything truly significant. At this point, the market has failed to capitalize on the bullish momentum, however we have seen extreme intraday volatility so we can't easily dismiss anything right now.

Update 2

Above we have a break of the a.m. range with a descending triangle which is a bearish price formation.

This 3C chart reinforces the negative break we see above with a leading downside divergence, but...

This other version of 3C is showing a positive divergence just forming.

Check back in an hour or so for another update

Update

It looks like the gap will be filled, to what drgree, I can't say yet, but look at the 3C charts below, each show there is no accumulation following the gap up, it does not preclude it from happeneing as the gap is filled, but as of now, it doesn't seem to be there.


UNG Still Strong

Russia is playing it's typical political "cut the gas flow" game again. UNG should benefit from it. This has been a long here for a couple of weeks, I wouldn't mind adding a little to it or establishing a position still if you haven't. You could open half at the open at market and wait (hopefully) for a pullback to add the other half.

A Short Term Long Position

This might be worth a shot, XIN long, either on the open or above $2.75. I'd use a stop around $2.50 so make sure you position size correctly as to not have too much risk in the position which is speculative by the nature of it's price and volume

One other thing,

The metals and mining sector has some news in it again surrounding China, but last week I talked about the momentum traders operating in that industry and mentioned URRE, I also listed quite a few stocks in the industry on the spreadsheet, take a look at those as possible long positions. Now we know why the momentum crowd was hanging around the sector.

Should I Hedge?

FXP is one inverse ETF on China, if the gap fills this a.m.  I would consider trimming down or cutting that position as the news prompting today's gap is related to the Chinese revaluing their currency.

As for other charts, I feel the same as last night, that it will be hard to say until we see a close and follow through, but if you feel the need to hedge out positions now, then you can use any of the Direxion 3X Bull:

TNA
BGU
FAS
SOXL
CZM

In this maneuver I would pull it off in pieces, maybe 25% at a time, but I would also wait a bit and see if the gap is filled, that would be the ideal time to make the switch. Then I would do the same tomorrow, another 25% toward the close if it looks like we are getting a bull move (close up today with volume and follow through tomorrow).

Otherwise, if you can wait it out until Tuesday, that would be my first choice, but you have to decide what is right for you and a 3x leveraged ETF is the quickest way to hedge.

This is why we are at 50% max short positions and no higher, not until the market proves itself. It leaves enough cash to hedge out your shorts.

I'll be updating around 11-12, whenever I see 3C's direction, which right now (as I said on TG last night) shows what appeared to be a gap up followed by weakness in the 10 min chart which could be today, but more likely to be in a day or two.


Reset Switch

Sometimes I post ideas and sometimes I don't. The reason being is that I want to be relatively sure of the market's direction, then I know which trades I want to look for. Friday's Quadruple Witching options expiration has thrown everything into the Bermuda Triangle again. I'm seeing a mixture of short term negative and positive divergences, in that case when I do not have majority confirmation I do not post any anticipated direction, it would be dishonest to act like I know where the market is going in the short run when I do not. Options expiration created so much volatility as they pinned the heaviest volume calls at $112. To make money you'd need price above $112 plus whatever premium you paid for the options. It seems to me that they fought it with a lot of volatility to keep it pinned and make all those calls or many of them expire worthless.

 I can come up with opinions of what that might mean, but there are so many strategies in options that you can never draw any accurate conclusions from them. We do have several reversal signals the last few days, it looks to me to be about time for a pullback, in that pullback we will have the information of whether we make a higher low or not which will tell us a lot. Should the market just peel off north then we have a different scenario altogether and our plan will be to sell bear ETFs a little at a time and replace them with bull ETFs and continue hedging in this manner until we get a reversal.

The charts now show what to me seems to be a clear path down, the question is when and how? The new Wall Street maneuver is volatile breakouts followed by failures, but we have yet to see a real failure.

Monday will begin the re-set. If we get higher prices, that is not out of the norm and it does not mean we are entering a bull phase, if Tuesday we got confirmation with a higher high and volume, then we have reason to start the hedging process. If Tuesday we see a failure to confirm as we have seen the last week, then we are on track.

The market is very much like professional poker. there are times to press, times to fold and times to sit and wait out the game. Right now it is time to sit and wait out the game.

I would post some short term trades that I see, (and I have in the last week, many limit order trades too which should be watched carefully for an opening), but I will not post those trades tonight based solely on the intraday volatility, the market seems to be heading in the desired direction and in the last hour it makes up all the ground it gained or lost during the day. Talking with floor traders, even the most adept that do this every day are getting massacred and when they move into cash to wait for clarity, who am I to say otherwise? I would not hesitate to say otherwise with clear direction from 3C, but it is not there in the short term (1-5 minute charts) which depict the daily movement and movement over several days and reversals. The longer timeframes are solidly negative, but as I said, getting from here to there can cost a lot of money if we do not have a strong edge. Many of you are here because of 3C's ability to give us that strong edge, when it's not there, I tell you.

I do not make market calls based largely on my experience and opinion, I make them on clear objective and overwhelming evidence. So I know it is frustrating to sit still, but for me to offer anything otherwise at this time would be gambling, a partly educated guess. You are not paying for a partly educated guess, you can do that yourself or get it froma thousand sources. You are here for the strength this system shows and when it shows that strength I will give you enough trades to keep you very busy as I often do. It's not there tonight.

Check back around 10:30-11 a.m. tomorrow. What I see now appears to be some sort of early strength, how long it goes on will be better determined tomorrow morning to the early afternoon.

Agin, if you have specific questions, and I answered several today with several page explanations, send them to me. In the meantime I will help all I can in whatever manner you desire.

Don't get too caught up in the early indications if they are very bullish. We just had an extraordinary round of bad jobless data an things are heating up in the middle east-the market hates uncertainty and will quickly mark prices down, thus the saying "When the missiles fly, it's time to by". the market would rather the certainty of war then the uncertainty of whether or not there will be a war.

Friday, June 18, 2010

Update

we now have 1 min neg divergences in all the averages. Look for a decline to set in soon

Options Expiration Friday

As pointed out by a reader, today is options expiration Friday with the largest open interest of SPY calls at $112. It will be interesting to see what happens, but expect there to be volatility in the area. Also I'm not sure I would take any break of $112 too seriously until Monday

Thursday, June 17, 2010

MEat Grinder keeps grinding away

Even intraday, this market is punishing anyone trying to navigate it. This is the most ridiculous manipulation I've seen in a top and truly it ought to be investigated by the SEC. With all their circuit breaker rules, why they allow this kind of senseless volatility to exist for the sole reason of stripping people of their accounts is beyond me, except for when I consider the fact that the government is complicit in these events or at least turns a blind eye to them. This is why we do not chase every 200 point day up or down. As I have recently pointed out, over the last 4 weeks, the market has gained no ground, yet we have seen the S&P rack up 29.13% up or down combined and 315.37 S&P points up or down and a net move over the period of +0.09% That's a lot of movement for not even 1%! That's what I call a meat grinder and that doesn't even take into account the intraday highs and lows-you could probably double those numbers!

Tonight I've taken some of the positions I posted about a week ago and updated them to reflect the market's move since then with new stops and entries, many can be entered now.

The end of day rally has me wondering what they intend to pull out of their hat in the a.m. Maybe a gap up and a bearish engulfing candle of that hanging man in most of the indices? That would be nice, at least we'd have some follow through and in our direction as well.

This is exactly the reason we have our core trending shorts at 50% and not 75 or 100%, the market needs to follow through and show us before we commit the rest of the position. Please consider not reacting to every shuck and jive of this market, that is exactly what they want you to do. Be patient and follow your risk management plan.

check out tonight's updated list. If this market does follow through on the negative divergence and hanging man, they should be in perfect position to make some money. This is not a market well suited to any kind of trading at this point, as today showed, even day traders can't hold a position more than a few hours without getting whipsawed. This is not by chance, it is by design.

Also check out the longs I put up last night in metals and mining, the momo crowd should be back and URRE that jumped 34%, was a long on 6/2's list. I hope someone got a pice of that one.

Look for an update in the a.m. I can't imagine the market will not have a reaction to the unemployment #'s that came out today, or at least that they won't use them to create even more volatility.
I have divergences in the DOW and QQQQ (interesting pairing) that are a hair from leading divergences. If this happens, it will be very bad for the market, it's literally ticks away.


Wednesday, June 16, 2010

Did you see that?

Last night I mentioned URRE and the momentum crowd seemingly getting ready to play this one. This is an elaborate type of trade in which the market maker is forced into a corner that actually causes the market maker to drive prices up. It's almost the opposite of the old time bear raids. In any case, it was up 34% in one day today. There was some room to make some money in it if you played it right. So the industry group has several more that could be potential targets.

Trade guild explains my view on the market, we know what we are going to do so long as we don't see upside follow through.

In the meantime, maybe you can make a quick buck in the Metals and Mining industry group that URRE was in. I listed a few long trades in the group as momentum breeds momentum. Take a look at the trades tonight, but remember that this is counter trend, a move like today's 34% should be taken immediately. These are also largely speculative so absolutely you must have risk management plans in place, but while the market is like the summer sea (flat, stinks to be a surfer), you might make something in one of these.

UPDATE Here's how momentum trades work. A market maker/specialist is the last resort, by law and for the privilege of making a market in a particular stock, these guys HAVE to take the other side of any trade that is at market if there are no other takers. So a group of traders or a black-box continually pounds away at the ask, the market maker raises the ask initially to discourage the buying which is diminishing his stock (actual supply), but he can go naked short unlike us. The momo traders keep hitting the ask driving price higher. At some point the market maker will run out of inventory and in effect be filling these market orders in a naked short position which he must cover. So the market maker tries to cover by buying which drives the market higher, and so on  and so forth and it can last for days and even weeks. It is typically in low priced NASDAQ stocks that have memorable tickers like BOOM  or CHINA (which is another one worth considering right now). I don't know why they choose these stocks, these tickers, maybe because the retail crowd remembers the name and gets involved, maybe coincidence. In any case, a market maker can be severely punished by these momo traders and it can take him a long time to work the bid and ask to get back to a flat or profitable position, that's if the momos don't show up again which they often do.  So whatever is going on in the Metals and Mining group, it appears to have attracted their attention. The only thing with these trades is when they disappear, the stock can fall like a rock so you have to not be greedy and watch the volume for signs of them leaving the trade.

So now you know.

Update 2

This is the morning range. There is a strategy used by day traders (although less effective in volatile markets like we are in now). when a trading range develops, the first breakout above resistance or below support is the direction the market or stock will close for the day. For a close up, then we'd need to see a breakout above 111.90 (SPY) and a close down a break below $111.20. It's not perfect, but helpful. In a volatile environment they are prone to false breakouts that usually return to the range fairly quickly. We still have negative divergences in the averages.

Update

OK, well last night's 3C charts of the Dow's negative divergences seem to be accurate meaning yesterday is likely to have been a false breakout. False moves create real and fast moves in the opposite direction. Lets see what we get today. If you are new, look t the core ETFs we are using to short the market and the limit shorts will start triggering if this continues down, so pay attention to them, put them on a watchlist if you can with an alert. TeleChart has this ability.

Lets see what this turns into, but you know my suspicions. As I was saying to newcomers, we want to be at about 50% short and the rest cash or a little in UNG long. Another 25% short will be added below SPY $104.40 and the remaining 25% stays in cash. If you don't have your positions, you should take any chance you can get (any intraday strength to short into). RISK MANAGEMENT before you place the order, not after!

Keep your arms and legs inside the vehicle, and put on your set belts, today is likely to be another volatile one.

Tuesday, June 15, 2010

Read Trade Guild tonight

Last time we had the NASDAQ breakout and the S&P and Dow fail to follow I felt the same as I do now, except today we had the mirror opposite. 3C is showing significant divergences to the downside, my money is on false breakouts today in the Dow and S&P, but if they are not, we can look forward to another rally and a right shoulder to complete a H&S top. News is not driving this market, it is being used to drive volatility. Fundamentals are out the window. How can you have a valid argument for fundamentals/economics when an index is down nearly 300 points in a day or two and then up 200+ the next? This is one of the toughest trading environments I've seen since late 2008 when the Fed was the culprit in manipulating the market.

I'm hesitant to issue any trades until this situation resolves which could be as soon as tomorrow if the Dow/S&P fail and the NASDAQ and Russell fail to make any upside. At that point things will make a lot more sense and our plan will remain valid and intact. If not, then be prepared to hedge and raise cash. You are now trading in one of the most difficult environments I've seen in a few years. As I shout from the rooftops every night , "RISK MANAGEMENT!"

THE UNG TRADE IS WORKING SPECTACULARLY, STICK WITH IT!

WDC is approaching an area in which it would make for a high probability low risk short.

Watch LZB (S) for a break below $10

Watch the SPY for a break below $111, it could make for a quick profitable short.

Any move up in the Dollar index or UUP will be very bearish for the market. It traded in a fairly narrow range today suggesting that the downside pressure may have subsided, there are short term positive divergences as well.

URRE is a highly speculative play, but it looks like the momentum crowd may be sniffing around. You could try a long on the open and close it at the end of the day should it take any loss or make a new low. This would be a quick pop trade only. It is highly speculative.

The exact same applies for URZ.

If we do continue on an upward trajectory, I have a lot of long positions that should do well(in an upside environment), BUT, Wall Street is using extreme volatility, as noted 2/3 of the market days in the last month have seen triple digit moves up or down. I do not think it is wise to chase yesterday's big move considering the fact that the S&P 500 has had a net move of -.50% in the last 20 trading days (4 weeks). This is the meat grinder. For now, lets stick with the plan until we see something suggesting otherwise. Chasing yesterday's triple digit move is more than likely going to put you on the wrong side of the next day's triple digit move. As I've stated before, your greatest edge over Wall Street is your ability to wait. Patience isn't easy, but it is exactly what is called for right now.

If you have an interest in a specific stock, email me. If you are even a little unsure about risk management, email me immediately.

Tomorrow is another day.

Update 3

This could be the false breakout attempt I mentioned last night, 3C remains in a deteriorating negative divergence

Update 2

The divergence to the downside is getting worse and prices on the SPY have broken the intraday uptrend

Update

A bearish ascending wedge in the 1 min SPY
Continued deterioration in the NASDAQ Advance/Decline Ratio

And mostly negative 1 min divergences in about 11 of 12 charts looked at.

This a.m.'s action thus far is inline with last night's forecast. We'll have to wait to see what this becomes, but it does not cause me any concern at the moment with regard to our bearish stance.

Monday, June 14, 2010

Clarity

We've found a spot of clarity, whether short lived or not, (volatility has masked Wall Street's intensions), it has confirmed the strategic outlook we've been preparing for for well over a month now. Trade Guild has the charts up today.

I do not think that I will be posting new trades tonight (although check in the morning as I'm still looking over charts) because I posted a lot of limit trades that should trigger if we get the downside that I believe we will see shortly. Also the core of our positions is in the inverse, leveraged ETFs. The only excellent long I'm calling out is UNG, it's not too late to buy it.

If you have a question about the outlook for any particular stock or industry group, email me.

Our plan has not changed, we are still looking to add the final 25% bringing us to 75% short when the SPY breaks the $104.40 area. We will keep 25% in cash for opportunities.

For whatever reason, it seems that 3C is one of the few indicators that is thriving in the new "volatility based environment". Traders are being punished all around trying to hold positions with this volatility and many feel they can not get ahead of the algo-trading. 3C seems to uncover icebergs. Right now we are on the event horizon of a dramatic shift in the supply/demand structure of the market as Wall Street has been busy laying the trap that will destroy a lot of accounts.

Wall Street understands that the dollar can not continue to rise without negative effects to the bullish environment traders still think we are in. Just like trading options and making a lot of money in your first trades, people become emotionally attached to that which has made them money, in this case the uptrend that started in 2009. Do not become attached to what was, the next event will not be the same as the last. Stand back and look at the world economy, what does simple common sense tell you about the direction of the market in the coming months?

Go back and look at the charts of the Dow now vs. the Dow pre-crash 1929, it is striking.

There remains the possibility, not probability, of a right shoulder taking shape, a 5-day chart will illustrate this possibility fairly well.

As for today's events, the Dow staged a one day false breakout. The NASDAQ, S&P and DOW are now in close parity. The dollar index took a big hit today, the market could not take advantage of it, rather chose not to. Gold has started to form a daily negative divergence, meaning distribution has begun in the commodity, this does not imply an impending reversal of trend, just that intensions are there and they do not portend for a healthy bull market in gold.

Based on observations, but still an opinion, I believe that we will see a market completely decoupled with the standard market relationships that have been in effect for over a century. Something very strange is happening and assumptions based on past market behavior are apparently being setup as a terrible miscalculation.

All of this said, I would be 100% remiss if I did not implore you to keep risk management as the forefront of your defenses. We could be 100% wrong, events could change the landscape and smart money is not always smart and reserves the right to change their mind with little notice. WhiLe I believe we are on the right track and I have a lot of money committed to this idea, we must always accept the possibility of being wrong and the only life preserver in such a scenario is risk management. IF YOU DO NOT HAVE A PLAN OR DO NOT UNDERSTAND RISJK MANAGEMENT, EMAIL ME IMMEDIATELY SO WE CAN WORK SOMETHING OUT TO PROTECT YOU.

Finally, this chart of the NASDAQ Advancers/Decliners clearly demonstrates how quickly the market turned today. As I said on Trade Guild, this market is in a lot worse shape than it appears to be.


Look for early updates tomorrow morning.

Update 3

We now have serious leading negative divergences in the regular 3 C indicator. By the looks of the candle formation, we could have something like a shooting star reversal. At this point, we now have an edge. We are out of the longs, save for UNG and if we needed anymore shorts, this would seemingly be the last best opportunity to get them considering the probabilities.

Update 2

You can read about this new indicator on Trade-Guild, here are the current readings-3/4 are negatively divergence, the IWM is not in a great position but I wouldn't call it negatively divergent yet using this version of 3C.