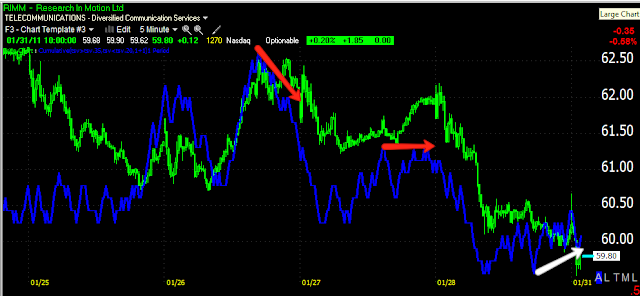
We've been paying attention to some of the market's bellwethers as they take turns for the worse, a sign you should always pay attention to. I've showed you AAPL, GOOG, BIDU and a handful of others, today lets take a look at RIMM.
3C charts in order of magnitude of importance
The daily 3C chart of RIMM gets interesting around July 2010 through November when a clear "U" shaped base is formed, 3C confirms this with a very positive divergence/accumulation. This is the start of the run when we get a breakout in November. For the most part 3C has confirmed price as being in a solid trend.
The first hints of major trouble brewing show up on the hourly chart, we can see the December top distributed as well as the 2011 top. There seems to be some slight accumulation but it could also be the slower 60 minute chart just hasn't caught up yet.
The 10 min chart shows recent distribution and is confirming the downtrend.
Mostly the same with the 5 min chart except we see a hint of a positive divergence again. This is not at all like the positive divergence that kicked this rally off, this would fall into the correction category which may set up a decent trade in RIMM.
The RIMM Daily Chart shows volume falling off into the trend, NEVER a good sign and the very long version of MACD I use shows a clear disruption of momentum. My first guess would be this is working on the head of a Head and Shoulders Top, but all H&S tops first start out as possible Broadening Tops. I think it will depend on the market whether this becomes a longer forming H&S or a broadening top. Right now, the indication target would be at $49-ish on the down side, but until the pattern is complete we don't know. What we do know is there's a number of high profile bellwethers breaking down into horrible market breadth. I'd put RIMM on a watchlist and check it every so often.
Is interest rates about to start going up?
-
Yes, I know - it does not make any sense - FED is about to cut
rates...but....real world interest rates are not always what FED wants it
to be.
6 years ago


No comments:
Post a Comment