I just read an article that said something that surprised me, not that I haven't been bearish on real estate, but it said nearly
11% of housing units are VACANT!
If there's a specific home builder stock you are interested in, let me know because there's a bunch that don't look so hot. Here's a couple of ideas.
GFA short- This is a big and very symmetrical Head and Shoulders top pattern. 3C daily has obviously called a top in it and it has broken down below the neckline of support.

Here's my moving average screen with my custom indicator to prevent false crossovers or whipsaws. You can see in green where it went long and in red where it went short. This is a fairly new signal so the trade seems to be in a good spot.
A better look at that H&S-again very symmetrical and the volume picked up quite a bit on the break of the neckline. There's a good chance it rallies back to test that neckline, that' why I prefer to phase into a position like this, maybe a little now and save some room in case it bounces so you can add at better prices. The pattern implied target is about $8.00 but there's ways to enhance those gains with a short position.
Here's LEN in a bearish ascending wedge. MACD has not built upon the September high at all. We see, as is often the case, a head fake right at the apex of the ascending wedge where many technicians are looking to get short the stock. The breakout on big volume to the upside puts those shorts at a quick loss and in a market with little volume, these are the tricks the market has resorted to to make their bonuses. The pattern still remains bearish and it's taking a turn downward now.

On an hourly chart you can see the initial head fake breakout led to no further upside whatsoever. The horizontal red trendline is a last stop area of support and if you want to be a little more cautious, you may want to wait for that support to be broken to go short, or you could phase in and add to the position there. Obviously you want an initial stop a little above the recent highs. New trades often need a little more room for the type of volatility that we see right here with the false breakout to the upside out of a bearish pattern.
LEN 60 mn 3C chart-looks pretty bad...
Here we have the Vortex indicator at the bottom crossing over and ADX has crossed 40 and turned down which often signals the end of the preceding trend (the end of the uptrend).
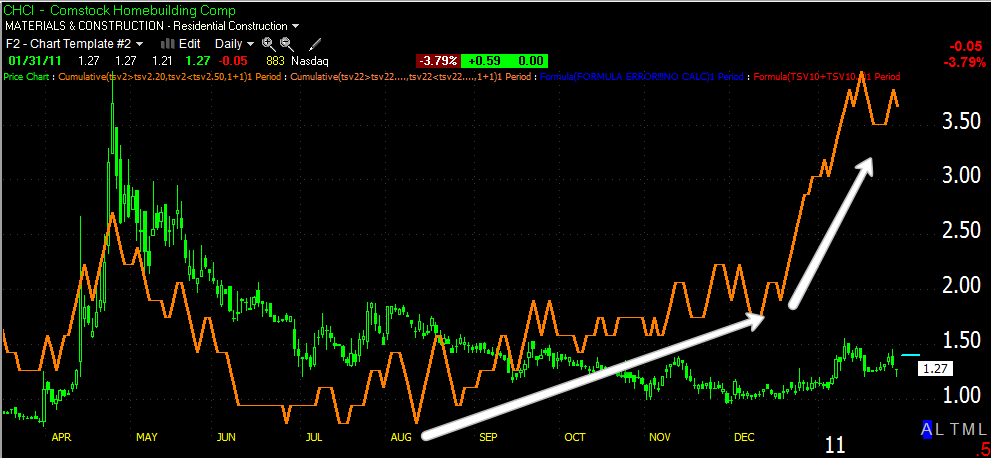
Here's a possible long, it's speculative in a few ways, but it may be worth a look. 3C seems to like the daily chart.
There's a couple of ways to play the stop, this Trend Channel setting has worked well in the past, it puts the stop pretty far away at $1.06. If you like the company, it may be worth a shot down there.
Here's an alternative stop at recent support around $1.20 although I'd move it slightly lower by a few cents.

Since today formed something that was almost a hammer, my preferred trade here would be a stop below today's lows on a closing basis and going long above today's high at $1.28
If you have questions, feel free to contact me. These trades will be added to a new list for February.


No comments:
Post a Comment