This is a long trade on the January list, it's set to Limit so here's how I see it working out to be a worthwhile trade. There are a lot of stocks getting pushed around and churned via HFT and other computer based/algo type program trading. Their character is very sterile, mechanic-like. This is an example of a trade that has a more organic feel to it, a flow that makes sense and a risk:reward ratio or setup that makes it worth a try.
Here are the charts....
Note the red trend line depicting resistance, it's also depicting what appears to be a base. From the left, the first green arrow is the low on big volume, we can pretty safely assume this is a capitulation event or the end of stage 4 (decline) losing about 67% from January 2010 until capitulation. The next green arrow is a second dump on high volume, but price doesn't make a new low, we have something akin to a successful test of support. The last green arrow is a breakout of the base on volume.
Here's a closer look at the breakout. There's 4 red arrows probing resistance; after the 4th we get a hammer at the first green arrow (support), the next day a breakout on rising volume. Then a few days maintaining support and another follow through upside move at the white arrow, again on volume. At this point we're at the early part of stage 2-mark up. There's a pullback from there, after all, we just saw a 30+% move in a month. The pullback is orderly, volume decreases showing sellers are not aggressive and yesterday was the lowest high/lowest low-we now have a trigger point and stop. The upper white line is the limit buy order around $5.11, the lower line is the stop around 4.91-not too bad as far as the risk profile goes. We just need that move above $5.11 to trigger a long and the probability of the resumption of the uptrend.
Here we are looking at a daily 3C chart. Note the capitulation event, which is marked by churning, is not showing a significant new low in 3C, it's nearly a positive divergence. The next white arrow is a positive divergence/accumulation and the stock rallies from there. The red arrow shows a negative divergence around the first probe of resistance, The White square is difficult to make out, but it's before the breakout and making a new high, it's a leading positive divergence, the best sign of accumulation and then we get our breakout.
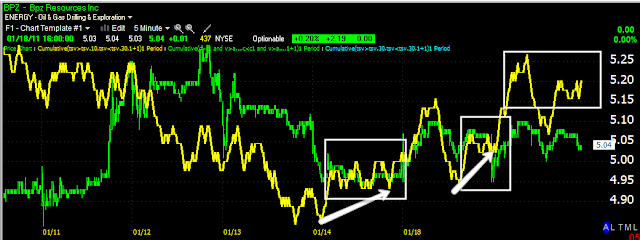
On a 5 minute chart, 1/12 is our high and subsequent pullback. Note the positive divergences in white and the last square is another leading positive divergence.
Using my custom screen, you can see the long signal in all 3 screens at Oct/Nov -not once since then has it given a sell signal. More importantly for our purposes, the breakout essentially starts a new phase, stage 2. After a strong breakout the first pullback is usually to the yellow 10-day price moving average, that's where we are now. A wider stop could be used below support at the red trendline, but what I like about the trade is the minimal risk in a high probability situation. I'd put 2% of portfolio risk in this trade no problem.
As for our target, the measured move is from $3.00 to approx. $4.75= $1.75+$4.75 gives us an initial target of $6.50. That's about $1.50 reward vs. $.20 risk or a R:R of 7.5 to 1 which is double my minimum R:R for a trade.
This is a specific setup and I wanted to share the mechanics of it with you. IF you have questions, please email me, I know there's a lot of different concepts stuffed in there, but this is a setup you can throw into your bag of tricks. Lets see how it plays out.
Is interest rates about to start going up?
-
Yes, I know - it does not make any sense - FED is about to cut
rates...but....real world interest rates are not always what FED wants it
to be.
6 years ago


No comments:
Post a Comment