Looking at the charts of EEM (Emerging Markets) and FXI (China 25 Index) they look remarkably like the market in the short term, more precisely, since Friday. Both FXI and EEM in the longer term look much worse as they are further along into their tops, but it seems people are still bullish Emerging markets and China despite the inflation factor and the measures they are taking or their people are taking to guard against the ill effects hot money flows have on their economies. I'm bearish on both long term.
EEM
EEM daily-you can see a pretty clear top in the price action alone, the daily 3C shows distribution at resistance of a small double top. The current reading on the daily is in a leading negative position, so the overall trade disposition is negative, but nothing goes straight down.
Here the hourly chart confirms the distribution at the double top.
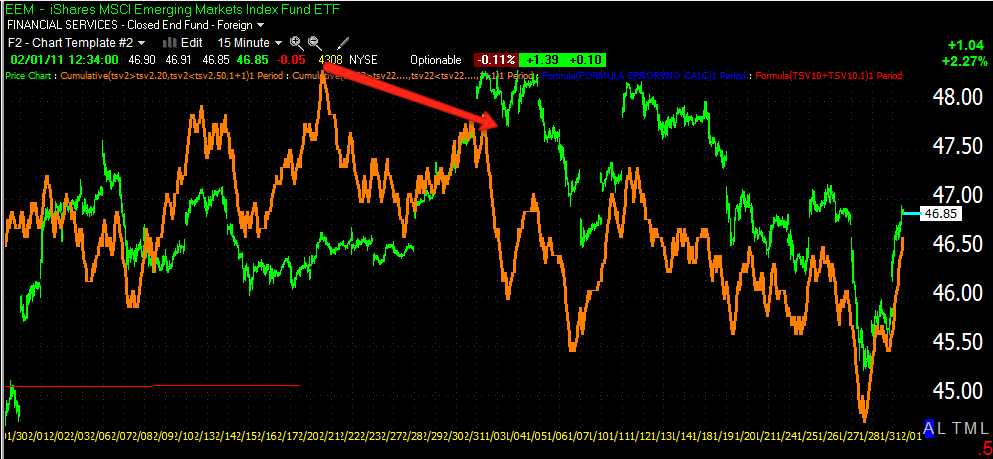
and the 15 minute chart showing distribution at the second top. To this point, there are no positive divergences on the longer term meaningful charts.
The 10 min chart does chow accumulation and it's exactly where it was found in the SPY, DIA, QQQQ and IWM-late Friday afternoon last week. If you refer back to the first chart at the top, you will see that the accumulation on Friday also is right at the top pattern's last ditch support level so it's not so strange to see a bounce off that support level as it is now the most meaningful level on the chart.
The 5 min confirms the finding above, accumulation late Friday afternoon of last week right at support.
The 5 min is also showing confirmation of the 2-day move up thus far.
As of now the 1 min is still confirming the move up, there is some heavy volume coming into the picture and 3C is looking a little more volatile here. I expect that this is a bounce and we may see another bounce or some congestion back down at the top's support, but I feel that it will break and this is one of the longer term trades that I like-of course on the short side.
FXI
FXI also has a topping pattern in price action.
The last time I updated FXI, it was breaking down out of that big bear-flag-like pattern. If you read that analysis it was right on as the break was for real, however once again Friday's lows hi the most important support level on the chart, the last ditch support of the top pattern.
The hourly chart shows the breakdown from the flag-like pattern and shows some accumulation at support.
10 min chart-Again there's that Friday afternoon accumulation we've seen so many places.. The 10 min chart is in a relative negative divergence.
Again, Friday's accumulation and more negative divergences.
The one min chart finds the same thing, we also have some volume spikes.
All in all, the moves on leveraged shorts are big, but I do not see this as changing anything technically in the picture. These still look like big tops and overcrowded trades that retail is still swallowing the bait on, while it appears institutional money has abandoned the trade a while back.


No comments:
Post a Comment