Here's SLV in a huge ascending triangle. An ascending triangle is a bullish continuation pattern, but it's much smaller. Whenever we see large triangles of any variety we have to consider the probability that they are a top of either intermediate or primary importance. In this case, SLV found at least an intermediate top. Again, recently the 50-day moving average has been conspicuous, there was some support and then a clear gap down through that average on 1/20. If you've been here awhile you know that I have not been bullish on gold or silver-of many obviously overcrowded trades, these were two of the most. The longer term chart doesn't look good, MACD (and I use a long setting) looks bad. Volume recently at the 50-day has dried up the last couple of days and we have (right now) what appears to be a hanging man candlestick although that could change by the close.

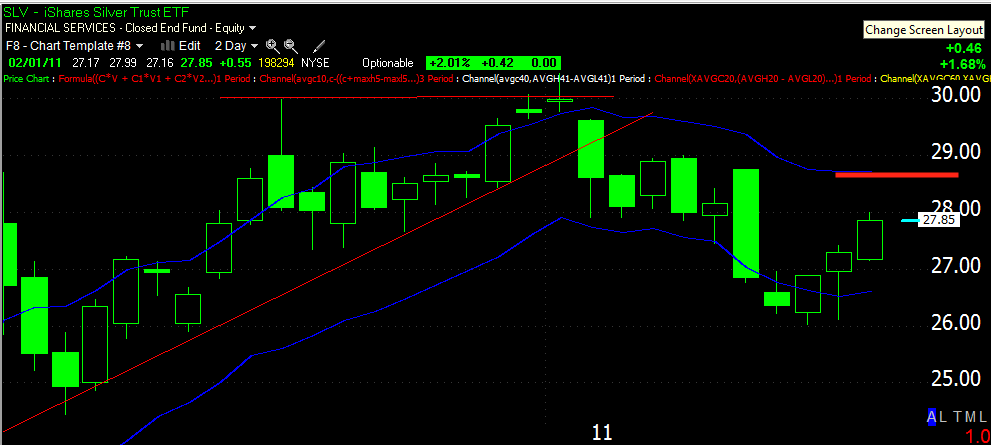
Here's the trend Chanel setting that has held SLV's uptrend, the cover stop is around $28.75. A move above that level would also destroy the downtrend's lower highs/lower lows.
It gets complicated here, 3C 15 minute is showing a pretty formidable area of accumulation which I would think would support more then 3 days bounce. Of course a bounce can be interrupted momentarily and continue or turn into a swing up. There are some signs of distribution, I think having more to do with the 50-day moving average that price is at.

The 5 min chart doesn't look all that bad, it's actually in confirmation of the price trend right now.
The 1 min chart has a small negative divergence, but I'm not sure it's all that relative right now.
If the 50 day average is broken to the upside, then I'd expect another shakeout move that could potentially approach the $30+ level. If we get a reversal down from the 50-day, I'd keep a tight stop initially until we see that it's not a one day rest.


No comments:
Post a Comment