These two tend to float with the market to a large degree, so I don't want this post to be about exact timing, but about the opportunity that seems to be emerging in shorting both E.M. and the China 25.
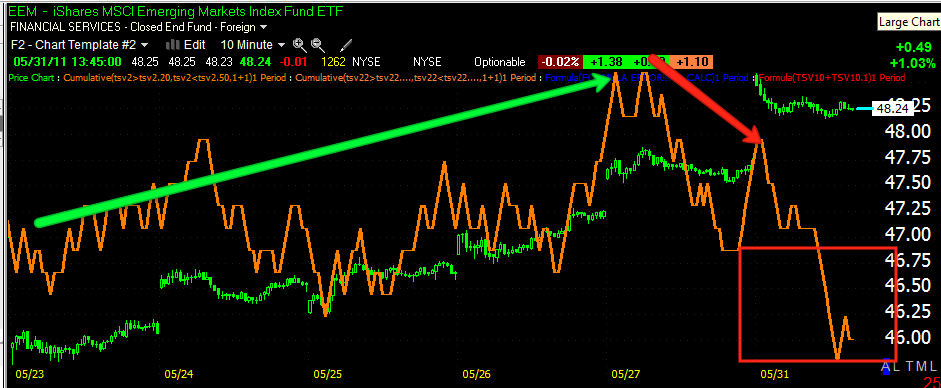
EEM-Emerging Markets- As I said, specific timing here is a bit unsure, it depends largely on whether the SPY can break $135 in the next day or two. There's a decent resistance zone right under $49, that would also make for a nice head fake, whether we get there or not, like I said, they float with the overall market. I do like the idea of starting a position here. It should also be noted that there was a breakout today around the $47.85 level which has seen resistance 3 times and as recently as Friday, it's also loosely associated with an overall larger topping pattern as support, which has been broken.
After a week of confirmation moving higher, this 15 min 3C chart went totally south today.
Confirmation is also evident on the 10 min chart, with a leading negative divergence forming today-this is the worst kind of divergence.
EDZ is the natural play to short Emerging Markets using an ETF. You can see the 15 min chart showed confirmation of the downtrend last week as we'd expect based on the charts above, and today a positive 15 min divergence. A 15 min divergence in one day is a strong signal.
EDZ on a 10 min chart is in a leading positive divergence, the strongest bullish divergence.
The 5 min chart went positive right at the open and is also in a leading positive position.
FXI-China 25

This is an ideal breakout, as far as head fakes go, it not only took out the recent 2+ week range, but also the resistance (former support) of a topping pattern. A failure of this breakout should lead to a quick move down in this ETF.
The 15 min chart has been in confirmation the last week or so and today went negatively divergent.
While the 10 min divergence is there, it's not quite as strong as EM above, but you can see the last cycle down starting with a negative divergence, confirmation of the downtrend and today that has been interrupted.
This is the 15 min chart of XPP, which has more leverage as a short on the China 25, there's not much volume there so I don't favor it, but I am showing you because it displays the same 15 min negative divergence.
All in all, I think EDZ and FXP are very close to buys in this area. Of course risk management should be your first priority. I'm available by email as always if you would like assistance in identifying a stop that works for your risk tolerance.


No comments:
Post a Comment