XLE Energy ETF
60 min chart is very bullish with a leading positive divergence, this is the longer term picture, not the day to day or intraday picture as it is a 60 min chart.
XLE 30 min shows confirmation of the leading positive divergence in the chart above, this is bullish for energy in the days and weeks to come.
XLE 15 min chart shows an actual leading positive divergence, but within that there are some negative relative divergences, meaning in the shorter term, there's going to be some bumpy ups and downs.
XLE 5 min shows confirmation of this morning's move and still a slight positive leading divergence, so there's still some lingering short term strength there.
The 1 min XLE chart shows a negative divergence right now, suggesting that Energy will shortly see some downside intraday and possibly over the next couple of days.
USO US Oil Fund
This is the hourly chart, a bit different then XLE as it is specifically the US oil fund, but part of energy. Here too we have a leading positive divergence for the bigger picture, but some negative relative divergences within that, suggesting some possible downside shortly.
The 30 min chart confirms the downside finding in a negative divergence on the day today.
The USO 15 min chart finds the same, so I'd expect a pullback to begin soon.
The 10 min USO chart is in agreement. USO looks a bit worse then the broader energy industry, I believe tht is because it has more specific correlation with the $USD.
The 1 min chart is simply in line right now, not implying strength or weakness. I expect this to change shortly.
Some of you wanted to see the leveraged ETFs in Energy specifically, here is
ERY Energy Bear
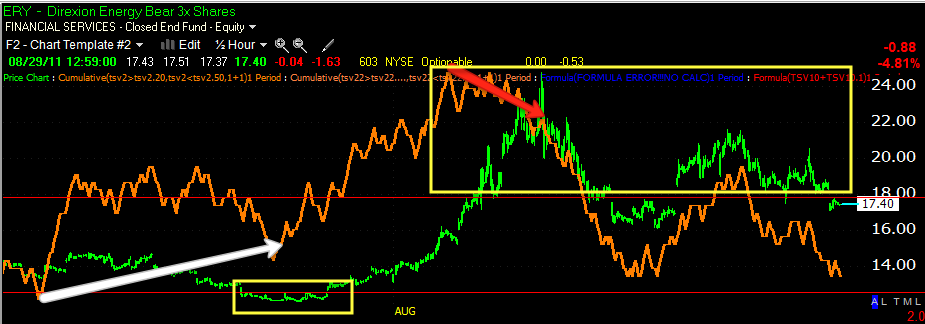
As you can see there was a channel it was trading in, it seems it's seen several head fakes and this most recent pop above the channel may be a head fake, it does fit well with my longer term theory on the markets, should ERY fall back in the channel for a period of time and accumulate more. However, this is the daily view, there's a lot of intraday and daily action not represented here and today's drop in the channel itself may be considered a head fake of sorts for the short to intermediate term over the next few days.

Here's the daily ERY showing substantial accumulation in to a flat trading range. Remember what I said about the dollar last night and how it appears to be putting in a larger base, that fits well with my theory on the market- a trip up to set up the second shoe to fall. That's a theory right now and subject to change, but it's what I expect based on the charts now. The two yellow squares represent head fakes, the downside head fake out of the channel was the last thing that happened during accumulation before ERY took off.
The hourly chart shows the same downside head fake and more or less in line 3C/price action.
The 30 min chart shows the downside head fake and what appears to be an upside head fake in ths rally above the channel-again this fits well with my intermediate trend theory.
The 15 min chart just shows some more detail of 3C action.
The 5 min chart shows the break lower from Friday's distribution leading to today's break back in to the trading range.
As I would expect, as I said above, today's dip in itself appears to be a short term head fake, we see some 5 min accumulation as I would expect.
ERX Energy Bull ETF
The hourly chart shows distribution sending ERX lower and accumulation and a longer term positive divergence.
The 30 min chart has more detail, but has the same findings.
So does the 15 min chart...
The 10 min chart shows today as in line only, no really bearish or bullish bias, this is kind of like the tide line.
The 5 min chart is similar.
Back to USO 5 min, this is showing the negative divergence on the shorter term side of the "Tide Line"
ERX 1 min also shows the same.
UUP-Prxy for the $USD Index
Note the strength today in UUP which suggests upside in UUP, which would put short term pressure on Oil specifically and Energy more broadly, also some pressure on equities.
The 5 min chart is showing the same strength toward a rising dollar over today and possibly the next few days-remember, I have always expected a false break or head fake to the downside in the market and don't forget the triangle's I showed you last night, it wouldn't take much to get there.
UUP is also showing signs of positive accumulation n the dollar-this is still somewhat short term, perhaps a day to a few days.
FXE-Euro Trust
In confirmation, the Euro is showing distribution, meaning a higher dollar is likely. I like to get as many pieces of the puzzle confirming the same thing.
FXE 5 min in confirmation of UUP and a stronger dollar over the short term-intraday to several days
As well as the 10 min chart.
As I warned about equities in the last post, I think the strengthening dollar has something to do with this as well as the likelihood of energy prices falling a bit on a stronger dollar, I expected a downside head fake over the short term (days) so this could be it, we still have longer term (week/s) that look very strong in equities and energy. This would provide the upside catalyst in the intermediate term and allow the dollar to accumulate more in the intermediate / longer term for the second shoe event which I think will see the markets drop substantially as I pointed out last night.


No comments:
Post a Comment