You can use the same link in the GLD post below for SLV and Friday's warnings.
SLV 1 min (click on the charts to enlarge) The green arrows show confirmation, the red arrows distribution, look at the flat range bound market with distribution, this a common feature in both accumulation and distribution. There was some early strength in SLV today intraday just like GLD, which faded into mid morning.
Here's a closer view on today's 1 min SLV chart. You can see the early accumulation to try to fill the gap, the fade of that around 11 a.m. and some recent small patch of accumulation with a slight leading positive divergence, remember this is intraday moves, so like GLD, I expect there to be some choppiness and maybe an attempt at a higher intraday high.
The 5 min hart shows the entire move from when I first pointed out accumulation and some of you traded this very well with options making over 100%, the distribution is evident and the longer term perspective shows a leading negative divergence, so while today may be choppy, it appears SLV will be heading down as for the bigger intraday picture and over the next day or so from this chart.
The 10 min chart shows the longer trend of SLV from turning down, to a slight bounce that we just went through which is normal in any downrtrend or even uptrend (pullback).
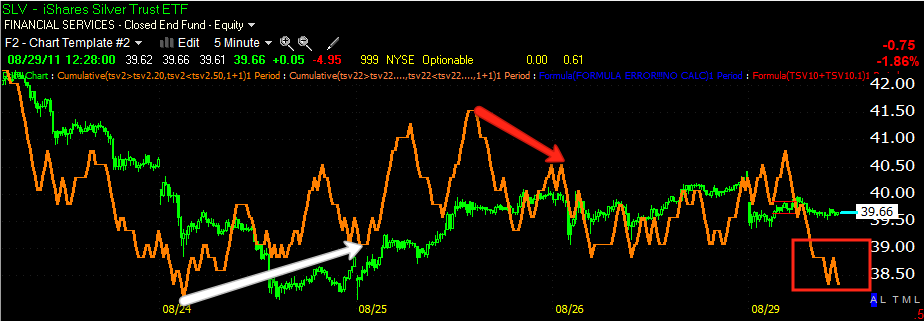
Here's a look at the bigger picture with SLV heading down, then up, then the head fake I warned about in the yellow box, to the reversal back down and a small counter-trend bounce which s what we are just completing. This chart would suggest that SLV has more downside as far as the bigger picture.


 | Theme by Thur
No comments:
Post a Comment