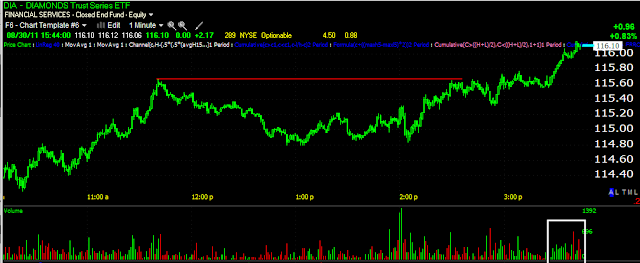
In my 2:40 post, Market Reversal I drew in some trendlines and said, "watch for a possible slight head fake above the red trendline as a solid signal and a move back below it"
Here's an update on those trendlines and where the averages are in relation...
DIA 1
IWM 1
QQQ 1
SPY 1
TICK chart
In all cases we are above the trendline as I suspected we might see. The point and purpose of this is to draw in longs who are buying what they see as a breakout, you can see on several charts volume expanded as price crossed the resistance level. When the market heads down, these longs are caught at a loss and start selling, adding supply to the market and causing the averages to fall harder then they otherwise would.
The TICK chart shows that the up-trend is starting to get shaky. We are in very fertile ground now for a reversal or gap lower tomorrow.
Is interest rates about to start going up?
-
Yes, I know - it does not make any sense - FED is about to cut
rates...but....real world interest rates are not always what FED wants it
to be.
6 years ago


No comments:
Post a Comment