I think at some point PCLN is going to be a good short, in the long run, I don't think we are there yet, but t is one of the stocks that have been on my watchlist because of my expectations for the market. A member asked about when PCLN would make for a short, there are two answers...
PCLN is what I call a bullish momentum floater, so long as there's some bullish action in the market, the longs that have traded PCLN for the last several years and have made a bundle are emotionally attached to the stock. This isn't a good thing, but when you keep going to the same watering hole and always find water, you develop habits. My belief for some time has been the market would rise enough for PCLN to make a new breakout high above overhead resistance, the bulls will rush to buy PCLN on a new high. Some time after that as the market begins to fold, PCLN should show distribution on what will probably be one of the most vicious false breakouts we have yet to see.

The 30 min chart is in line at the green arrow, meaning the trend is confirmed as PCLN's price makes higher highs, so does 3C. This makes me think over the intermediate term trend, PCLN can accomplish this new high breakout. For those of you trying to better understand 3C, look at the negative divergence on this chart in red, note that 3C is lower at the second relative point then it was at the first relative point (marked by small red arrows), however price is higher at the second relative point then the first, so we have price moving up, 3C moving down. This is a relative negative divergence because it is relative between two points and there is less institutional money flow at the second point when prices are higher, meaning institutions have been distributing or selling, this precedes the reversal down. Remember institutional selling can include short selling, 3C sees selling as selling and does not distinguish between selling a long position and selling in the market of a short position. So the big short that I see for PCLN is still some ways off.

There is a smaller short of shorter time duration that may be available . This 15 minute chart is often the chart in which we see swing reversals on divergences between price and 3C. Here we have price heading higher, but 3C heading lower, showing less institutional money n the trade at higher prices, meaning they have been distributing or selling short.
We have confirmation on the 10 min chart of the same.
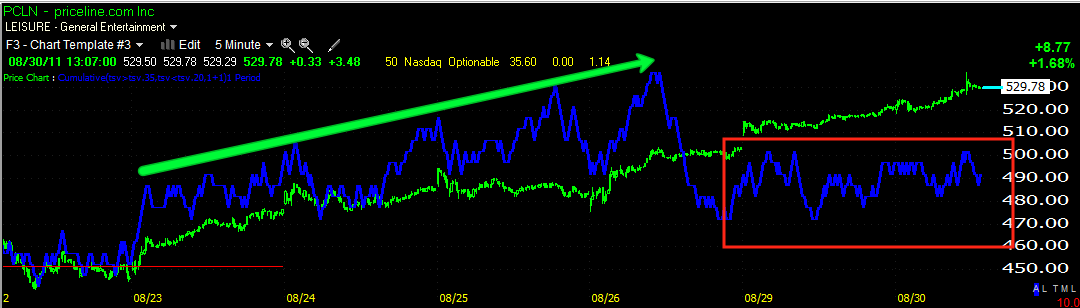
We also have a leading negative divergence on the 5 min chart, it is leading because price is making relative new highs while 3C is making relative new lows. A leading divergence is one of the strongest and being it is on the 5 min chart, it is likely to spread to the more important 10-15 min charts.
The 1 min chart also shows a negative divergence at the open when PCLN made a brief rally attempt in a parabolic way.
Being we have a negative divergence on the 15 min chart and confirmation of negative divergences on the 1-10 min charts, it is reasonable to think PCLN will see some short term downside and be a short sale. Because the 30 min chart is still very strong, I don't see this as a key reversal, just some downside over the next day or two.


No comments:
Post a Comment