There are a lot of pieces, thus a lot of charts.
First I'll start with an example.

Here I'm using the 3C depth chart for the SPY to show some accumulation relationships. Notice EVERY trough has been an accumulation zone followed by higher prices, even at the very far left when the market was topping. Each zone is labelled with the number of days the SPY was under accumulation and then at the level of positive divergence, the shallower the trough, the heavier the accumulation. For instance, the second from the left, this was a time in which the market was falling and all people saw were lower prices. 3C started to show accumulation and we started talking about a bottom at a time when no one was thinking this market would stop falling. There was 3 days of accumulation at the -114.90 level, which resulted in a rally of 8.9% from lows to highs. As far as the history goes back here, there hasn't been 1 failed signal, however, the market does through surprises our way from time to time. The most recent accumulation zone was about 2.5 days at -111, the shallowest reading, meaning the strongest accumulation, from lows to highs, 6.6% and we have pulled back for 2 days. This reminds me of a rally in August.

This is the August rally I am reminded of, 3 days of accumulation around the -113 level followed by 2 days of a move up and a fairly steep pullback of 4.6% in a little more then a day. The thing is Wall Street, smart money, institutional money, whatever you want to call them, accumulated a position and unless they lose complete control of the market like the Lehman era, they will take the market higher, make their money, distribute their shares and get short for the end of the cycle with a stage 4 decline.
Here's what happened after that very steep pullback, the market continued higher for a 9.5% rally from accumulation lows to distribution highs.

Here is the pullback and our current pullback of 3.8%. I'm not particularly worried about it, this was a fairly deep accumulation zone at 2.5 days and the lowest reading of -111. I actually added some positions back today and I'll sleep fine tonight. Even at a 3.8% pullback, I'm still at a profit and even if we pullback more, I'm still at a profit and should everything fall apart, my risk management plan will keep me from taking any substantial losses, by this I mean even if this accumulation zone failed (and at 6.6% gain from lows to highs, I would consider it an unfinished cycle), I would still likely not take a loss more then 3% of my portfolio. For the month of September, the WOWS model portfolio is up nearly 82%, yet I still use risk management planning on every trade. Some people think that they can't make money with a 2% per position maximum risk/ loss of portfolio. I'm using less then that per position and still am close to doubling the model portfolio in 30 days using no options. I did start the options model portfolio this week, it is already up 11.87% on the first trade. Gaps are always the hardest thing to deal with in risk management, it doesn't matter if you placed your stop and used proper position sizing if the market gaps through your stop. I use to deal with this by keeping each position at no more then 15% of the total portfolio value. Then I created a chart in StockFinder that determines the maximum gap for any equity over the last year. This gives you an idea of the worst gap volatility you may experience and I often use that as my risk per share in my risk management calculations now. If you are using StockFinder, this indicator is available to you through the share function, I would highly recommend it.
Here are the current market charts...
DIA 2 min end of day relative positive divergence.
DIA 5 min, the same
DIA 10 min is still pretty positive, today it spent most of the day in a positive divergence.
The DJ-20 10 min is in a leading positive divergence as well as an relative positive divergence on the day.
DJ-20 shows Tuesday's pullback as well as a nearly day long positive divergence today that is close to leading status.
IWM 1 min divergences near the EOD and after the move below the intraday descending triangle.
The 2 min chart shows the same.
IWM 5 min positive divergence after a break lower from the descending triangle.
IWM 10 min over all looks pretty good here as well.
The IWM long term 15 min chart over the past 6 weeks or so still looks strong and suggests the same thing we have been seeing in multiple timeframes, especially longer ones and that is the theory I've had for at least a month, that we will ultimately see a longer lasting move higher, we may see a new low in the market first though, that would make the most sense to me.
The IWM 30 min chart has been in leading status since the market bottomed, this is not a timeframe that we would use for the multi-day rallies we have been trading, this represents a larger trend as I mentioned above.
QQQ 1 min EOD positive divergence.
QQQ
QQQ 5 min positive divergence
QQQ 10 min chart, like the other averages, looks very good all things considered and is in leading status.
QQQ 15 min leading positive divergence.
SPY 1 min positive divergence after the market broke below the descending wedge,
remember what I said in this post... "I would think for a head fake, to make it worthwhile, they (Wall Street-SmartMoney, etc) would want to make it as convincing as they can, which would mean sending it lower, otherwise what's the point?"
SPY 2 min positive divergence
SPY 5 min positive and much of it coming after the break below the bearish descending triangle.
SPY 15 min s in line with price.
As for currencies, the Euro has been weak, which typically sends the dollar higher, this is negative for equity prices, so lets take a look at the currencies.
FXE-Euro Trust this is yesterday's 1 min chart
For comparison, here is today's 1 min chart, it looks much better.
Yesterday's 5 min FXE , even though the position was leading, there was a negative divergence on the day yesterday.
Today's 5 min chart, looking much better today.
The $USD via UUP showing a negative divergence as it moved higher today.
The 2 min chart shows the same.
As does the 5 min chart.
TLT-20+ year Treasuries
TLT is in green and the SPY in red, as you an see there's an inverse relationship between the two, making bonds a safe haven trade when the market is weak.
TLT 1 min showed distribution today in to the EOD rally as the market headed lower.
The 2 min chart also shows distribution in TLT
The 5 min also showing distribution
VXX-yesterday VXX looked very good,
you can see in yesterday's update
VXX 1 min doesn't look nearly as good as yesterday, remember this is a volatility indicator and like the VIX, trades inversely to the market.
This is an example of how VXX looked yesterday, which prompted me to say that by the looks of the VXX, we should expect at least early downside in the market today.
VXX 2 min negative today
Yesterday's VXX 10 min chart-looking very strong.
Today's VXX 5 min negative
VXX 15 min leading negative
And the 30 min is also leading negative, this again is in regard to the probability of a longer term move up in the market sometime possibly in the next several weeks.
Equities that tend to have a leading relationship with the market...
EEM Emerging Markets are one of several sub sectors that tend to lead the market. EEM 1 min not only went negative on Tuesday before the SPY, but is also showing a fair amount of strength today in the underlying 3C action.
EEM 2 min is in a leading positive position
EEM 15 min hit a leading positive divergence and is showing a fair amount of accumulation, not seen in well over a month on the 3C depth chart.
The hourly, which is not relevant to the immediate trend at hand, but to the longer picture I have mentioned, seems to also be indicating that we will see a larger more sustained move up within the next several weeks or so.
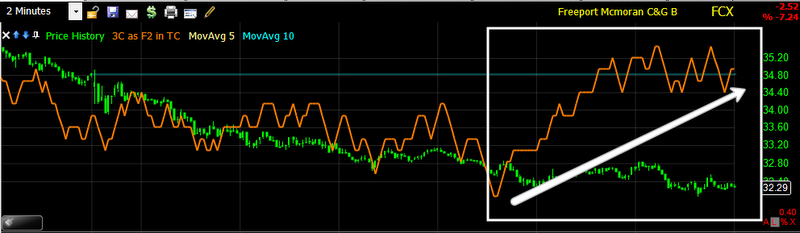
FCX-Copper s well known to lead the market
1 min FCX yesterday, quite negative
1 min FCX today, a big change in character.
FCX 5 min yesterday was negative implying at least weakness in the early half of today.
Today's FCX 2 min chart has improved dramatically.
Yesterday's 10 min FCX chart, looked pretty bad.
Today's 5 min chart and 10 min chart below both show dramatic changes in the underlying tone of the trade.
FXA-Australian Dollar also trades with the market and tends to lead it frequently
Here's the correlation with the SPY.
FXA 1 min showing positive divergences today.
FXA 2 min also showing good positive divergences, especially after the market broke lower from the descending triangle which I suspect to be a head fake, especially given the fat that nearly every hart shows that time period to be under accumulation.
FXA 5 min positive divergence through the entire day today.
KOL is another ETF that often leads the market, so looking at the underlying trade by smart money is important in trying to put the pieces together to get a composite picture of the market.
KOL 1 min positive
KOL 2 min positive nearly the entire day-THIS IS EXACTLY WHAT I WAS LOOKING FOR IN THE PULLBACK AS MENTIONED ON TUESDAY BEFORE THE MARKET EVEN PULLED BACK, WHEN WE FIRST SAW NEGATIVE DIVERGENCES.
The 5 min showing Tuesday's negative divergence suggesting a pullback and the reason took partial profits and today's leading positive divergence.
KOL 15 min positive, this is very positive leading, again suggesting a longer duration trend up is coming in the near future.
The 30 min chart shows the same. Being that we are below the bear flag, indications of a longer term trend up would be right in line with the games Wall Street plays as it would cause a massive short squeeze which would initially give the trend a lot of momentum.
So far I like what I see in this pullback, I'm glad I took partial profits and started adding some positions back today, while others hope to add back tomorrow. This pullback of the last 2 days looks very much like what we saw in August in some of the first charts in this post. I will continue to hold my long positions unless something changes radically. My current equity longs are TQQQ, UDOW, UPRO, URTY, FAS, TNA, TYH and BAC. I also have positions unrelated to this current cycle which are longer term positions that I am building in UNG and DGP. I'm also looking for an entry in to USO, probably via UCO.
As for my options positions, have calls in November Calls including DIA with strikes at $105 and $106,; November calls in the SPY with strikes at $110, $111 and $112; and QQQ November $52 Calls.


No comments:
Post a Comment