So muh for supply and demand moving the market in general and Crude oil in specific, is it OPEC? Is it Tensions in the Middle East and Africa? Is it the Iranian plot to assassinate a Saudi diplomat right here in the US that is moving oil? NOPE! Just adjustments to the dollar.
USO
USO 1 min chart expanded view-The recent divergence here is leading negative, even at new highs
USO 1 min chart close up-shows us a negative divergence on the open, a slight positive divergence around mid day sending USO higher intraday and since a leading negative divergence.
USO 2 min chart A longer term negative relative divergence and some accumulation sending USO higher today.
USO 5 min chart expanded view-There's a lot here -the red and white arrows are the same I use for 3C divergences, the green and orange are rallies and declines that resulted from the 3C divergences. September a negative divergence sending USO much lower, but there was heavy accumulation into the decline as marked in white with a leading positive divergence sending USO higher. Several short divergences moving USO intraday and a current, very ugly 1 day leading negative divergence. This would imply there's heavy distribution in to the gap up today which also broke a closing resistance level at $33.25 which may be a head fake move/bull trap.

USO 15 min chart -This long term view shows 3C cause and effect from divergences, again with orange arrows representing price declines, however, like I explained earlier about the market and SPY, there's a long term positive divergence of accrued accumulation that allowed USO to really turn upward on a dime without the need for a "U" shaped bottom to accumulate. Currently this chart is in a leading positive position, partly as a function of the amount of accumulation that went in to this current leg up. There is a relative negative divergence on USO today.

USO 60 min chart -The hourly chart shows a much less optimistic picture, being a longer timeframe, it s a more important chart, it doesn't give us the same detail as the 15 min, but does show what is a relative (longer term) negative divergence, again this is a function of the long term 15 min accumulation, it's a lot of shares that were accumulated by Wall Street and a lot that need to be distributed, thus we are seeing a 60 min negative divergence and today specifically it has gone leading negative which would imply the price strength is being used to distribute-either selling or short selling.
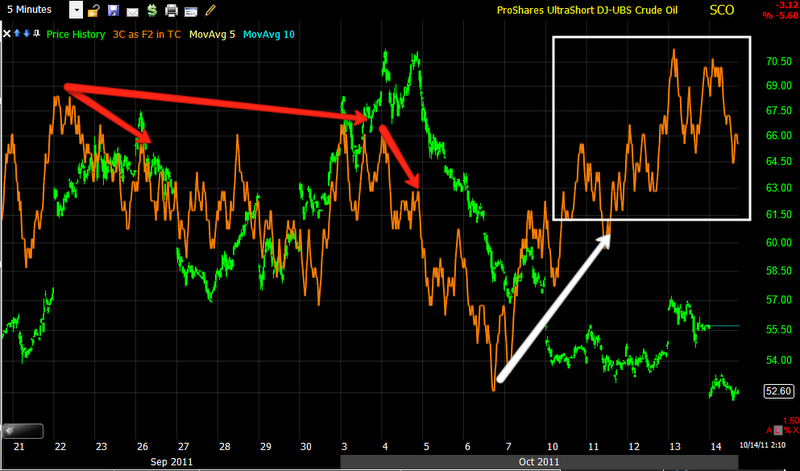
SCO-UltraShort Crude Oil
SCO 1 min 3C chart expanded view- a longer term 3C positive divergence
SCO 2 min 3C chart -Shows several positive divergences in a base like atmosphere including the very common and likely, head fake/false breakdown/bear trap- as SCO broke resistance today, but maintains a positive 3C profile, most likely any stops that were taken out were accumulated as this is one reason for the head fake/false moves.
SCO 5 min 3C chart 0Shows the topping of SCO as well as what appears again to be a base with a very positive leading divergence
SCO 10 min 3C chart -positive divergences
SCO 15 min 3C chart positive divergences on an important reversal timeframe.


No comments:
Post a Comment