Credit continues to deteriorate, although now equities are more closely following credit as they should, which taken with recent (last month or two) readings, suggests very strongly that as 3C depicts, the October rally as well as the volatile lateral topping price action in the market has been uses almost exclusively to sell risk assets (most of that being liquidations of equities, mutual funds and hedge funds by European banks in an effort to raise their cash levels as I have already explained, their leverage ratio is much higher then the United State's-26:1 meaning for every $26 in risk assets they have $1 of capital to cover potential losses, meaning a 4% move against their positions WIPES OUT the banks entire equity and this is why they can not find cash via other banks as is normal, via swap lines, or traditional libor related outlets and have turned to one of the most surreal places for short term funding-the London Stock Exchange-which is another canary in the coal mine, but when this one goes belly up, England will be dragged right in to the core contagion, something they have so far managed to avoid. How British regulators allow this to happen is obscene, but no more so then the way US regulators have handled MF Global's liquidation). In addition to selling risk assets, it would be naive to think at the same time they were not establishing huge short positions (Trading Desks). The 3rd outflow or distribution in the market is plain old redemptions in which even flagship funds have had to sell assets to cover redemptions (most of which are coming from Europe, but I imagine all financial sector participants are trying desperately t reduce their overall exposure).
Here are my credit indicators, both short term for today and longer term as they are new and you need to be reminded of how far out of whack they still are with equity pricing.
First commodities which I will cover in another post as they relate to China, they recently have underperformed equities, suggesting that even while the risk off trade over the last 3 days has been in effect, commodities are selling off at a more rapid pace then equities, this morning on a short term basis, equities caught up to the selling in commodities as fears in the equity market are starting to see that pendulum effect I talk about (they swing way too far on the bullish end and then swing way to far on the bearish correction).
Longer term sine 2009, commodities have led the market, showing a disconnect with equities in Q1/Q2 of 2010 that sent equities lower from their highs, another disconnect at the 2011 area, just before the equities crash in late July / early August and currently another disconnect as the October rally has swung too far with the pendulum effect, so equities still have downside risk just to catch up to commodities in the bigger picture.
The Euro/Equities relationship that usually has a 1.0 correlation or nearly perfectly in sync, which was not the case while the F_E_D's Quantitative easing was in effect, but the relationship is returning back to normal, the Euro, as I have commented recently, has been much lower then the market and implied arbitrage correlations, today there is a short term move to catch up and reestablish the correlation.
Slightly longer term, but still intraday, here is the disconnect with the Euro still far below equities, remember the typical correlation is a 1 pip move in the Euro= 2 Dow-30 points. I have to see how far above the correlation the Dow is, but I'm fairly sure it's over 500 points rich.
Here on a daily chart we can see there's still a large disconnect between equities which are overvalued and the Euro, even the velocity of the recent move down has been much different and I commented on this last week when the Dow was down about 200 points, but the 1 day correlation suggested it should have been down more then 300 points.
My custom financial's indicator-this is not comparative analysis, but a true indicator, Equities have moved lower to catch up, intraday, financials seem to have a slightly better performance, only slightly.
Longer term, on a daily hart, the indicator called the July/August melt down is stocks and has a large disconnect again right now.
High yield,"Equities follow credit" has shown several areas in which equities made for good shorts as they moved up on sugar rush high "news" while credit remained unfazed, in each case equities quickly moved lower, they are now short term in sync with HY credit.
Credit shows to the left that the market will rise before the market even bottoms, then shows the July top and a current disconnect suggesting more downside catch up for stocks.
High Yield Corporate bonds and equities move well together and are short term in sync.
However on a longer term chart, you can see where equities are out of sync with HYC, the higher the red bars, the more out of sync.

The market tends to revert to the mean of yields and in red we had a major disconnect, the market has since fallen of course and is moving closer to the short term relationship, however on a longer term basis, Quantitative Easing so badly distorted true price discovery as hundreds of billions of F_E_D dollars were pumped in to the stock market, there remains a huge gap between rates and the market. This is the danger of QE that I warned of for the last year, stocks were artificially inflated, not due to true demand, but due to F_E_D money put into the market via the F_E_D's primary dealers through their POMO operations which are now discontinued. The value of stocks is so inflated artificially, that one POMO stopped as IT HAD TO because of inflationary effects, there would be a massive re-valuation of stocks toward their true worth, this is an avalanche waiting to happen and in fact, since July, has been happening.
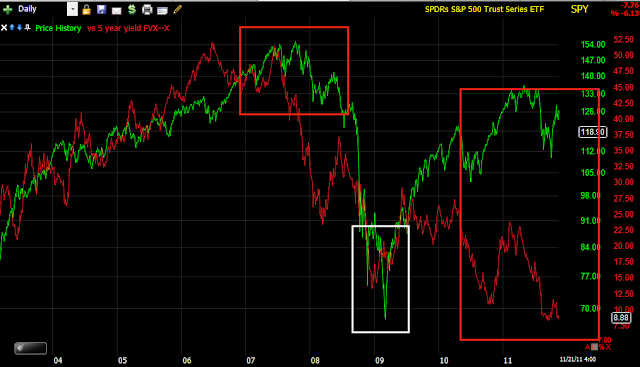
Here long term rates called the 2007 top and the 2008 fall in the stock market, it also called the 2009 bottom in the market before the market bottomed and now is at such an unbelievable disconnect, it suggests that "if rates remained constant and did not move lower due to market conditions, that the true valuation of the market would be somewhere around or actually below, the 2009 lows, which is what 3C has been showing, a leading negative divergence that is deeper then the 2009 low, in fact the worst I have been able to find over the last nearly 100 years! While our models are singular so we can track the particulars of each asset class and better predict sector rotation such as commodities signaling a problem in China and our models also allow for long term analysis, the CONTEXT Model is basically all of these models combined so you can see where ES is trading vs. where the risk assets (above) suggest it should be trading for the day.

Here the risk model shows ES (S&P E mini futures contracts) are still trading rich compared to the risk basket and have more to fall to catch up.
Here's the difference in the model showing a growing disconnect between ES and the risk model.


 | Theme by Thur
No comments:
Post a Comment