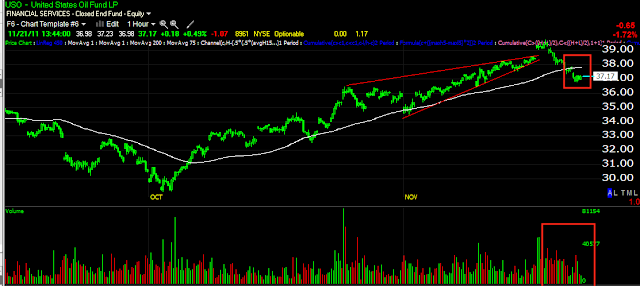
The USO daily chart with a bearish ascending wedge that started on the first 3C negative divergence, it also is the place in which Crude/USO broke it's long standing correlation (inverse) with the $USD in what is now appearing to be one of the biggest head fakes I've seen in USO, unless there is still an underlying fundamental reason that we are unaware of ( like plans for Israel to attack Iran). With very simple volume and candlestick analysis, the top in red was called a "top" on that day, large volume and the inability for USO to close any higher then it opened suggested large scale bearish churning, or institutional money dumping their shares to dumb money, who are now at a sizable loss.
Here is USO compared to the Euro, it should track nearly identically, again you can see where the long standing correlation was broken, the same spot as the original 3C negative divergence and it is where the bearish ascending wedge started to form.
On an intraday basis, the Euro has rallied, pulling commodities or at least crude up a bit off the lows as the correlation should.
The long term moving average defining the trend has been broken to the downside on increased sell-side volume, much of it likely from buyers trapped at the $39+ level.
The 1 min 3 hart has gone from slightly positive to slightly negative.
The longer term chart shows accumulation that started the USO uptrend in white to the left and distribution throughout the bearish ascending wedge, the exact reason these price patterns form. There is some recent 15 min. strength and for those who want to add to USO shorts or want to establish a new position, we may get a good, high probability/low risk opportunity soon. Just as I never chase longs out of greed, I don't suggest chasing shorts out of greed, a little patience will often get you the exact position you want.
Here I can see the probability for USO to move at least to the 10-day yellow moving average, that would be an "okay" entry on the short side, but not a great one.
A 50% retracement of the fall, would make for a good entry near $38.50 for 2 reasons, the 50% retracement being the first, the kiss of the ascending wedge's apex "good bye" being the second, this would offer a high probability, low risk short side entry and chance to add to a USO short through leveraged inverse ETFs like SCO or DTO.
The 30 min chart, which is more important because of the longer timeframe suggests massive distribution in USO, which means to me, if I'm holding a short in USO, I don't mind letting USO rally a bit to add to my short or start a new short at better, less risky levels. The fact the 30 min chart is so negatively divergent gives me some comfort in holding my current USO shorts or in starting a new short position as the distribution seen on this hart is very serious and points to much greater downside risk in USO, so a counter trend rally for me is a chance, not a concern.
The short term 2 min SCO (UltraShort Crude) chart has seen a few counter trend moves on negative divergences, I would hope to see a deeper pullback then the last negative divergence to add to this position or DTO or if you don't have a trade on, it is worthy of consideration as a new trade once it gets in to a bit less risky position with much higher probabilities of success.
As for SCO, the 60 min chart has had a solid bullish crossover on my custom screen, a pullback to the $40 level would be an area in which I would start paying attention and looking for an entry (long SCO/DTO --- short USO).
Is interest rates about to start going up?
-
Yes, I know - it does not make any sense - FED is about to cut
rates...but....real world interest rates are not always what FED wants it
to be.
6 years ago


No comments:
Post a Comment