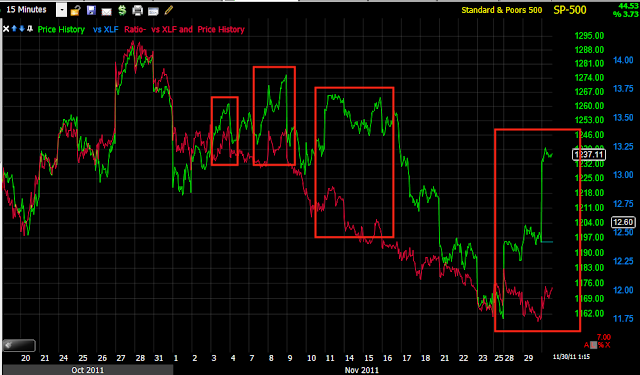
Last night I worked on creating an oscillator that would better display dislocations, it is a step in the right direction, but still has a flaw as I had to use the rate of change between the risk asset and S&P to create the oscillator function, the problem that I still have to overcome will be evident in a chart below.
By the way, the CONTEXT model is leaking lower then ES which kind of confirms at least some of what we saw earlier in commodities and what we will see in this update.
First the hourly chart and the oscillator below, this is commodities, dislocations between a risk asset like commodities and the S&P which theoretically should move together in a "Risk on trade" provide good entries it seems as you can see, shortly after the dislocation, the S&P in green tends to fall. The oscillator being above the zero line signals a dislocation which you can also usually see in the upper price window when comparing the performance of the two assets being compared. The closer the oscillator is to zero, the more in sync the two asset classes are performing. On a 60 min basis, I was surprised to see the recent commodity strength still is underperforming the S&P and thus providing a dislocation, I'll keep that in mind if I enter FCX short.
Intraday commodities are leaking lower then the S&P, this is no surprise considering the retracements of 60+% in commodities, Copper and Crude that I posted earlier.
60 min High Yield shows the dislocations pretty well and this is what I was hoping to see on a bounce to add to shorts. Note each dislocation in red is followed by a drop in the S&P. Theoretically this is because in a risk on rally, all risk assets should move together, when credit fails to confirm a risk rally as a risk asset, then there's a problem with the rally, most often recently these dislocations have occurred on knee jerk reactions to sugar rush news items in which credit (the less emotional ) is not impressed and refuses to rally with equities (the more emotional).
Several dislocations in High Yield including today, but I put this chart to show you that credit has not broken above the highs of 6-7 days ago while the S&P has, it's just a way to show you the relative performance of the two assets.
The Euro which has a strong correlation with the market of about 1.0 meaning nearly identical, shows a massive dislocation right now, even though it is rallying, just not to the extent of the implied/historical correlation.
Intraday, the Euro first outperformed the market and now is underperforming. Remember the average correlation between the Eur/USD 1 pip move is 2 DOW points, so looking at the hourly chart, I probably should figure out what the implied fair value of the DOW would be as that is the potential target on the downside assuming the market doesn't overshoot and assuming the Euro didn't leak lower.
High Yield Corporate Credit has been the stronger of the risk assets, there are several dislocations as you can see on the hourly including one now, each of these has led to a move lower in the S&P.
On an intraday basis, the dislocation between HYCC is not as obvious as it is on the hourly chart.
Here's the Financial momentum indicator which was mostly in line with the October rally, but near the top started to dislocate badly, which eventually led to the drop, even with the market blasting higher this week/today, the momentum indicator is very weak and at new lows below the October market lows for 2011.
Here's the intraday Financial momentum indicator, it is certainly weaker then the market, however it opened much stronger.
Here's a 15 min chart for comparison and several dislocations, right now being one of the stronger ones, about on par with the last one which led the market lower.
This is hourly yields and this demonstrates the problem I still have with the oscillator. There's a very clear dislocation between rates and the S&P and the S&P tends to gravitate toward rates, however, because the S&P was outperforming at the second cycle (the long one) and it is obvious to see the dislocation, the Oscillator doesn't work well here because it is based on RATE OF CHANGE and Rates were virtually flat, no change for ROC to measure, even though they were clearly weaker and dislocated from the market and even though the market fell toward them. Currently in the price window, the dislocation is obvious.
The intraday of rates is deceiving because of scaling, but note that they have not moved higher since Monday while the S&P has, the red trendline shows resistance in rates and intraday they are leaking lower as well as seen at the red arrow.
A little longer scale look at Rates.
Is interest rates about to start going up?
-
Yes, I know - it does not make any sense - FED is about to cut
rates...but....real world interest rates are not always what FED wants it
to be.
6 years ago


No comments:
Post a Comment