This is one of those weeks where the fundamentals change so fast and are so unpredictable, that following the short term charts is about all that can be done. There's about 0% chance smart money knew G-Pap would call for a referendum when his own finance minister didn't know, there's less chance they knew there may be a coup brewing a the military in Greece is reshuffled. It's one of those weeks that again, is very reminiscent of Lehman 2008.
DIA 1 min showed the positive divergence the earliest and now we have a negative, whether it is a consolidation or a reversal is hard to say, we are near resistance in some of the averages.
The DIA 5 min seems to show this latest attempt having less underlying velocity and is negative.
I finally (through the help of a good friend) got my 3C ES back up and running, this shows all the move today and has a relative negative divergence from the earlier leading positive that got the rally started.
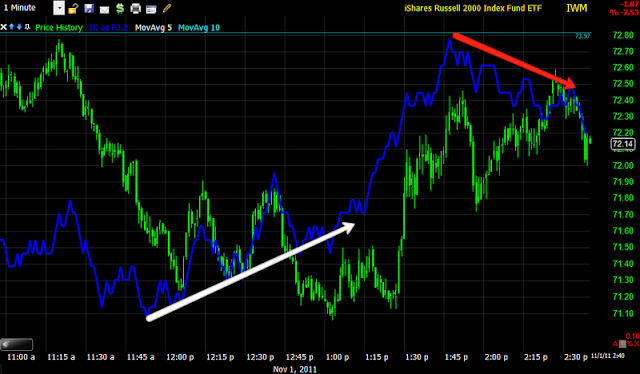
IWM 1 min shows the accumulation for the move up and is negative here.
The 2 min is even more negative
QQQ 1 min wasn't looking all that strong earlier, it looks the weakest now
And the 2 min is negative as well.
Here is the SPY vs the Euro (red) and as you can see, the SPY has been held up by resistance while the Euro has made a new intraday high. I'm guessing that this is more risk off related then anything as the correlation between the two is usually nearly perfect except for the last few days.
SPY 5 min is relative negative.
The TIK chart which shows an uptrend around the 2nd intraday rally is now getting volatile and looking as if it may break the up trend channel as we are at S&P resistance.
Is interest rates about to start going up?
-
Yes, I know - it does not make any sense - FED is about to cut
rates...but....real world interest rates are not always what FED wants it
to be.
6 years ago


No comments:
Post a Comment