15 and 30 min charts start leading negative in a single day.
DIA 30 did a lot of leading negative for a day and a half, these charts take time to move.
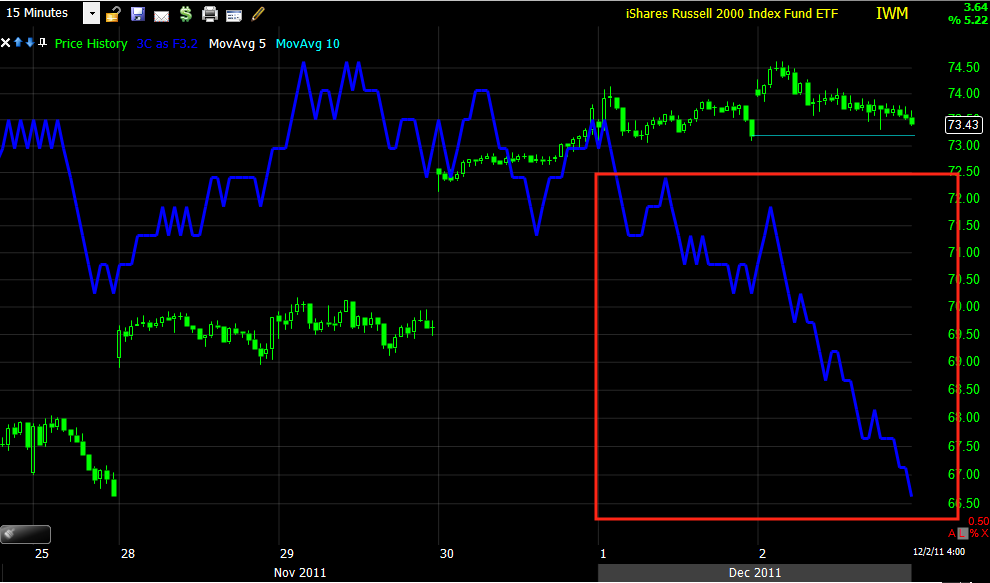
Look at the IWM 15 min
And the QQQ 15 min
As well as the SPY 15 min.
This is when intraday charts can bounce around as much as they like, but it's pretty hard to overcome a 15/30 min leading divergence that forms in a single day.
Many of the charts you see here at WOWS are my proprietary indicator 3C which reveals underlying institutional money movements and often contradicts price. To understand the annotations made on charts, you must first understand that 3C has no numerical value, it is a pure divergence indicator. Positive divergences represent accumulation by smart money, negative divergences represent distribution by smart money and when 3C trades with price, that is trend confirmation.
The chart annotation system is simple; white arrows represent relative positive divergences, red arrows represent relative negative divergences and green arrows represent trend confirmation. When 3C is in a white or red box, that represents a leading positive or negative divergence, leading divergences are the most powerful.
We analyse 3C in multiple timeframes, the longer the timeframe the stronger the accumulation. 1-2 min timeframes represent intraday moves, a 5 min timeframe can represent a day or two and 15 min timeframes average trends of a swing trade nature. 30 and 60 min charts can move the market for a month or more and daily charts can be over a year.
You'll get use to seeing the charts and understanding how the multiple timeframe analysis works and works well.
Welcome to Wolf on Wall Street.
The trades featured here are meant to maximize returns with the least risk and highest probabilities. Unless otherwise mentioned, all trades are meant to be executed at market. I prefer long-term trending trades which perform well in rising markets, but really stand out in declining markets. However, we get occasional one day gifts 30,40,60% 1-day gains. I'd urge you to consider taking some or all off the table in such cases, the markets don't give gifts like that often or for very long. Most of the returns that make the system outperform so well come in short-entry trades. If you are opposed to short trades, this is not the system for you, unless you are ok with buying an inverse ETF. If you would like more information about the truth about shorting stocks, just email me.
Risk management. I recommend a specific and consistent risk management approach to all positions. In most cases we try for 2% risk money (2% of portfolio) unless such a position size exceeds 15-20% of overall portfolio in actual position size. Each trader is different and each has a different allowance of open trades. I like to keep the overall money in the trade around 10-15% of portfolio per position in case of gaps against you. Stops are generally executed at the end of day and I personally never place a stop order, all my stops are mental; remember, the middle man gets to see everyone's cards. When you are not in tune with the market or opportunities just aren't that spectacular, I take my risk per position down to 1% or even half a percent of portfolio value.
Each trader is different and must determine their own level of comfort with risk. I do have a channel stop which I provide to TeleChart/StockFinder users for automated stops, I appreciate you using my links to sign up if you do. The Trend Channel catches trends and works well as it automatically adjusts for each stock's volatility. Arbitrary exits based on nervousness about the markets WILL decrease the portfolio performance dramatically. This system will not ever get you in at market bottoms or tops. The recent 1 year performance against the Russell 2k buy and hold had the system beating it by 3:1. Ultimately it is up to you as to how you proceed, but I'm always available to help you determine what might work best for you.
I do use other scans and systems when market conditions warrant their use and may change strategy with market conditions.
The MOST IMPORTANT tool you have to bring you long term success is RISK MANAGEMENT. There are plenty of articles linked at Trade-Guild.net on Risk Management. We can be wrong 75% of the time and still outperform the market with solid, consistent risk management.
Position Sizing
The position sizes noted in the positions @ 2% risk of portfolio are based on a $20,000 portfolio-adjust as needed. Due to tight stops, there is the possibility, even probability that one position could take up the entire portfolio. You need to decide how many positions you want to trade and reduce the position size according to that. For instance, if you want to trade 5 positions in a $20,000 portfolio, no one position should be valued at more than $4,000-not risk money or 2% rule, but share price entry x shares.
Is interest rates about to start going up?
-
Yes, I know - it does not make any sense - FED is about to cut
rates...but....real world interest rates are not always what FED wants it
to be.
Futures Update BR-EXIT Edition
-
So the conventional wisdom couldn't have been more wrong. Those chasing
risk and closing hedges couldn't be in a worse place right now. I would
still remin...
This website may include stock and market analysis. Any opinions, ideas, views and statements expressed here are opinion only, subject to change without notice and for informational purposes only. Trading stocks carries a high degree of risk. It is possible that an investor may lose part or all of their investment. Accuracy and timeliness of any information is not guaranteed and should only be used as a starting point for doing independent additional research allowing the investors to come to his or her own opinion. Nothing on this blog is to be considered a buy, hold or sell recommendation. *Wolf on Wall Street portfolios are PAPER TRADED, no real money is used. Any investments, trades and/or speculations made in light of the opinions, ideas, and/or forecasts expressed or implied herein are committed solely at your own risk, financial or otherwise. Results are dependent on market conditions, timing and trading style. Comments posted on Disqus Threads are not moderated and are not representative of opinions of authors of this site.
Translation: You are responsible for your own investment decisions. Not anyone else. YOU.
Position disclaimer: Authors might OR might not have position/interest in securities mentioned on this site!
Affiliations:
Authors of this blog might receive commissions and other considerations from:
Correspondents' emails are strictly confidential. The third-party advertising placed by ad networks may collect information for ad targeting. Links for commercial sites are paid advertisements. Blog links on the site are posted at my discretion, without compensation of any kind.


 | Theme by Thur
No comments:
Post a Comment