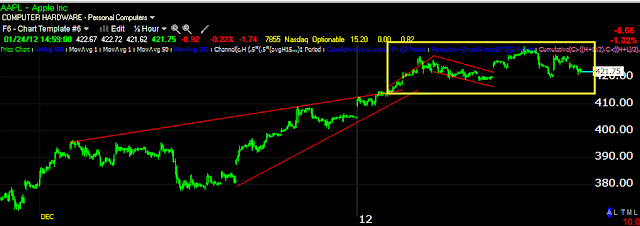
My AAPL Puts in the option model portfolio are at a slight profit, last night I also covered AAPL in my wrap on Monday's trading action.
Strangely, the NASDAQ 100's biggest component by weighting is not trying to fill the gap today and is heading down with 3C confirmation.
This is what I view as a head fake move in AAPL, there are two that are part of one larger move, first the breakout from a bearish ascending wedge and then a breakout from a bull flag, I entered my puts the next day.
Here's a closer view, the yellow box is where I initiated the PUTS, a break below the yellow trendline should be a high probability lower risk trade as it will confirm the head fake move in AAPL and trap a lot of very loyal longs.
On a long term 60 min trend, you can see 3C went negatively divergence right at the breakout of the ascending wedge and the bull flag which is in the yellow box. The long term trend seems to be indicating the move above both patterns has been used to sell/sell short by smart money. For newer members we have been tracking AAPL for some time, there have been many negative occurrences such as an all time new intraday high put in and AAPL couldn't hold it, it couldn't add to it. There have been many other events as well, and in general AAPL longs are in love with the stock, which makes for a great bull trap.
I would put AAPL on your watchlist and watch for a break below the $415 level.
Is interest rates about to start going up?
-
Yes, I know - it does not make any sense - FED is about to cut
rates...but....real world interest rates are not always what FED wants it
to be.
6 years ago


No comments:
Post a Comment