This is the SPY wedge that is also apparent in all the major averages to one degree or another, it is also the area I have been saying looks very dangerous, long term 3C charts show no support for this area and instead distribution. We even saw the head fake breakout from the bearish wedge, which sucks traders in from a short position on a bearish wedge to a long position on the apparent failed pattern, these almost always resolve to the downside after the head fake in yellow.
Here's the gap from this morning the SPY will try to fill as very few gaps are left open.
The SPY 1 min 3C chart showing the late day negative divergence yesterday, leading to the gap down today, right now the 1 min chart is inline, but there was no positive divergence even on the 1 min moving it higher.
Here's the 2 min chart showing yesterday's late day negative divergence and again confirmation this a.m., but no positive divergence to kick off the gap fill which is unusual.
The DIA and its late day negative divergence leading to this a.m.'s gap down as it saw distribution in to the close.
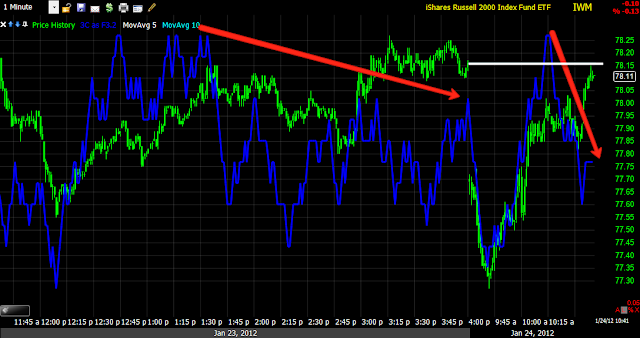
The same is evident in the IWM 5 min chart
We see the same negative action yesterday in the IWM, the only difference here is the IWM is close to filling the gap and is starting to show a negative divergence now that the gap is filled.
QQQ 5 min has been in a leading negative position for several days.
Look for the gap fill and likely negative divergences, there may be a fade trade for intraday traders coming up.
Is interest rates about to start going up?
-
Yes, I know - it does not make any sense - FED is about to cut
rates...but....real world interest rates are not always what FED wants it
to be.
6 years ago


No comments:
Post a Comment