Throughout 2011 we saw massive outflows from equity funds, $140 billion to be exact. The volatility that really increased starting May and running through the rest of 2011 may have some correlation with the fact that starting April of 2011 and running through the end of the year, there were 35/36 consecutive weeks in which money was pulled from the market, yet the market still managed to end the year with only a slight loss. The obvious answer to this (as we would expect redemptions to cause forced selling, in effect increasing supply and lowering demand which should have sent the market lower) is volatility is being used to prop up the market. Of course the more volatility in the market, the less investors want to be in the market. That would also seem to be the obvious answer as to why so many gaps are filled, the daily volatility that goes from lows of the day to highs of the day, but doesn't move the market much, certainly would be expected to fill a lot more gaps then usual; that's a hunch, not science.
Psychologically it seems the market is much more bullish then it actually is. Take today for instance.. Here are the major averages...


Averaging the major averages, today yielded a gain of .058% . You might think to yourself, "It's still a green day", however, if you consider that yesterday the S&P was up .89%, the NASDAQ up .71%, the Dow up .56% and the Russell 2k up 1.49%; then even the measly returns of yesterday couldn't generate any follow through buying interest at the time of year when money is supposed to be flowing back in to the market. In that light, you have to ask yourself a question that is a little more farsighted then 1 day or even 2, "Is every green day a bullish day?"
If the Russell can put together a 1.49% gain yesterday (which is fairly solid for recent action), but it can't follow up the day with demand and produce a follow through day of at least 1% on some decent volume, is that bullish or bearish?
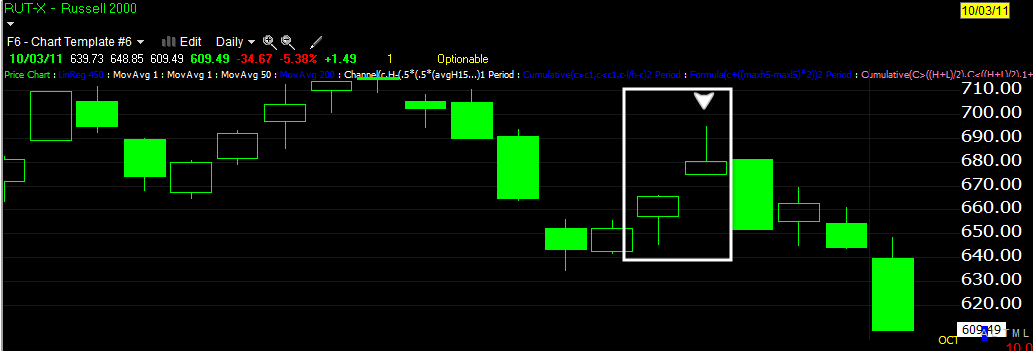
I spent at least one class per semester (when I was teaching technical analysis) teaching students what a solid breakout or a solid move looks like. One day a trend does not make, so we look to the next day for what is called a follow through day. A follow through day ideally produces a bigger gain, it does so on increased volume and it closes at the top of the range; if any of those components are missing, a follow up day becomes suspicious. Say a follow through day (after a 1.49% gain) moves as high as 3%, but then gives back half or so and ends the day at a gain of 1.75%. Literally speaking, you have the higher high and bigger gain, but you end up with a price candle that looks like this...
Or how about a follow through day or even a series of them, but volume is declining? Even if the day closed near its highs, the lack of volume tells you that traders are not so enthusiastic about chasing prices higher.

Day 1 +3.66%
Day 2 +4.41%
Day 3 +5.01%
Day 4 +5.29 % (so far so good, lots of good follow through days on increasing volume)
Day 5 +10.26%
Day 6 +3.61% on lower volume. You can't argue 3.61% is not a nice gain, but it should be sounding some alarm bells.
Day 7 +2.34% The day closed up, it closed near its high, but price gains are falling, volume is falling, the message of both are, "Traders are not so enthusiastic about chasing this higher". Looking at the single day you might be inclined to be happy with it, it has added to the gain, apparently closed strong, but 1 day doesn't make a trend and put in its proper context, your trade management should be tightening stops, you have been warned by the market.
Over the next 6 weeks you have a return of .51% -DEAD MONEY.
The point is, not every day that closes up is bullish.
Here's 1 more example (this may seem to contradict some of the above, but there are some concepts you are familiar with and honestly the importance of volume and changes in character, even slight, are becoming a lost art) :

One last example, the Russell 2000 performed the best today. A look at the 4 pre volume relationships reveals a piece of the puzzle, here's how they stacked up:
Stocks in the R2k
Close Down and Volume Down: 467
Close Down and Volume up: 256
Close Up and Volume Up: 451
Close Up and Volume Down: 644
The semi-dominant relationship is close up and volume down, it is also considered the most bearish relationship among the 4. Close Up and Volume Up is considered the most bullish relationship. Close Down and Volume Down r Close Down and Volume Up are subject to interpretation depending on where the market is. For instance, in an oversold pullback within a larger uptrend, Close Down and Volume Up can be considered bullish as it suggests a bottom has been put in. Here's an example...

Again, my point is simply, just because it is green, doesn't mean it's always bullish. The opposite is also true, just because it's a red day doesn't mean it is bearish. For example, pullbacks are necessary, stocks can't rise forever without becoming overbought and risking a huge down day. To take the example to the extreme, a capitulation day that may gap down 10% on huge volume and close at its lows is not always bearish, toward the end of a bear market, you need these capitulation days to start a new uptrend. I suppose more then anything, I'm saying you have to keep the big picture in mind, price alone is often deceiving. I would never make an assumption about any asset based on price alone, price is just 1 piece of the puzzle unless you are a day trader.


No comments:
Post a Comment