There are a lot of other charts I want to include, but since there's a move unfolding a bit quickly, I wanted to get at least this out.
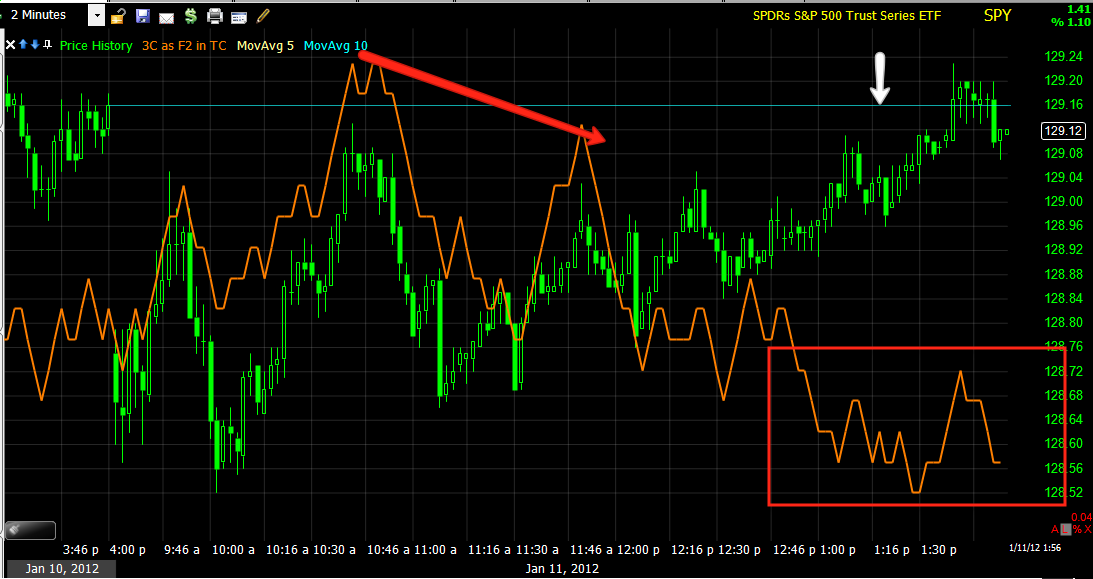
Every average has an intraday pattern similar to this as seen in the SPY, it's very wedgie and obviously a bearish wedge, the breakout as is standard operating procedure has occurred, this is where we watch for the downside move. It's pretty close to a confirmed head fake, t may be at that by the time I get this out.
Yu can see 3C has been negative in the pattern as well, it is a bearish pattern, it's just the bullish head fake breakout that almost always happens and thus far has.
DIA has been negative in to the same pattern.
This is more or less confirmation with the negative divergence marked as well.
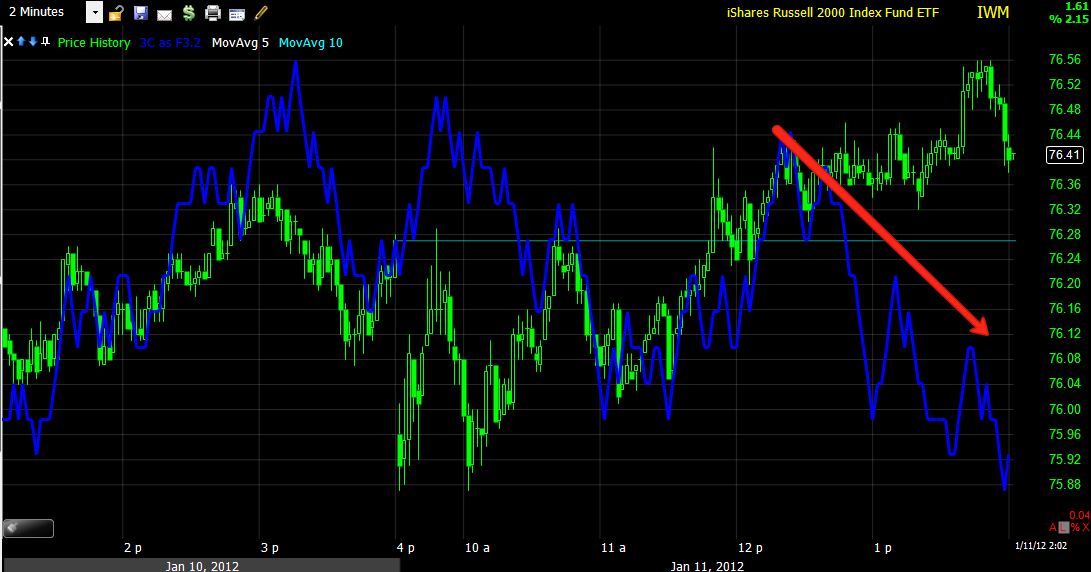
The IWM has shown a pretty sharp lading negative. The actual breakout, if viewed with a 10 min chart, looks very similar to a candlestick "Tower reversal"
Just for perspective, the 15 min IWM chart.
The Q's look a bit different, but the break and negative divergence are happening at the same time as the other averages.
And a little longer timeframe intraday on the Q's
Interestingly, the 5 min covering yesterday and today is negative at both
More to come


 | Theme by Thur
No comments:
Post a Comment