As a side note, ES is moving down now close to unchanged from yesterday's close...
So in doing my research on bear market rallies, as I posted Sunday, I stumbled on this...

Here's the Dow-30 with a 14 day Average True Range in the middle window and the Close Within Range Indicator. The Dow is unique among the averages when looking at the rally from December 20th through present in that it is wedging (bearish ascending wedge). The red arrow marks the 20th of December. Note the recent breakout above the ascending wedge, although in nearly 3 weeks (14 days) of trade, the Dow has gained +1.29%, that use to be an average day for the market not to long ago, not over a 3 week period. What is very curious though is the ATR, which is the range from high to low that the market (in this case the Dow) moves in. ATR is averaged, although you can see the 1 day ATR, but the trend is what tells you something. In this case we see the ATR (daily range) plummet as the rally develops, from about a 216 point daily range to a 123 point range. If this were a strong healthy rally, we'd expect that ATR to at least hold up if not increase, yet it is down by nearly 45%.

In the same period, the NASDAQ 100 is more typical of the market, what is immediately striking on this chart is the fact that there are virtually no pullbacks, any healthy rally sees pullbacks. This instead looks more like a short squeeze, the only problem is that NASDAQ short interest at last check was at 10 year lows. The indicator that shows the close within range seems to indicate that getting the market to close green is what is important here, not so much digesting gains and consolidating to build a strong trend that shakes out weak hands, which is the purpose of pullbacks and why they are healthy for an uptrend. Looking at the ATR we see an average 47 point daily range slide all the way down to a 27 point range, this is less then the 40 point range seen in April of 2009 when prices were 58% lower!
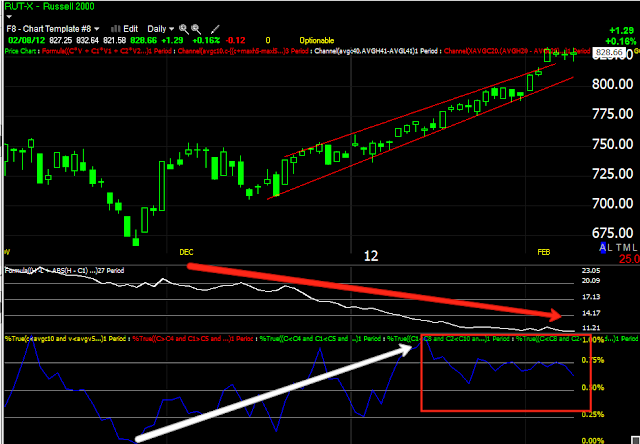
The Russell is one of the few that is seeing the Close Within the Range drop off to about 50%, , which could look like today's doji, that is a close at about 50% of the range, also a signal of a loss of momentum. Note though how earlier in the trend, the close within the range was advancing. Again, no pullbacks in price of any significance at all. It's one of the strangest price trends I've seen. As for the ATR, it has been cut in half as the rally has developed.
The S&P maintains the image of strong daily closes, but very small moves. Here the range drops from 28 points to 13.75 points.
I changed the ATR to a 5 day ATR just to see if it would change, it didn't. The range dropped 25 to 11 points since late December.
I looked at the bear market rally in the SPX in 2008 and saw very much the same thing, ATR dropped off from 32 points to 18 points, also in a similar wedge like the Dow right now.
This is the period represented above...
Although this rally hasn't seen any substantial pullbacks, you can see as it advances the ATR also advances, granted this is a more powerful rally.
DST in terms of percentage gain over the same period is on par with the market, it saw several healthy pullbacks and while the range didn't move higher until recently by about 30%, during the rally, the ATR managed to stay within a normal range of $.95 to $1.03, it didn't drop off by 50%.
So the question with bear market rallies, is whether it is a real rally that wants to carry the market higher on true risk appetite and underlying fundamentals that create that risk appetite, or whether it is a facade meant to look like something very impressive to drag investors back in to the market before leaving them holding the bag. Considering the ATR, the small price advances, the lack of pullbacks and recently in the DOW not only a bearish price pattern with what may in fact be the tell tale head fake, but a move of 1.29% in 14 trading days, I'd call this a very suspicious rally.
The danger in bear market rallies is that they slam the door fast and hard, the entire rally can be wiped out in 1/5th the time it took to build it. Even worse, bulls who recently entered the market because of the rally, have been well conditioned to "buy the dip" and the first correction in a bear market rally is just as dangerous as the initial break as longs double down.
Be careful, be thoughtful and aware of your emotions. More then anything, look at the charts, sometimes the piece of information that is most valuable is very subtle and often fleeting.


No comments:
Post a Comment