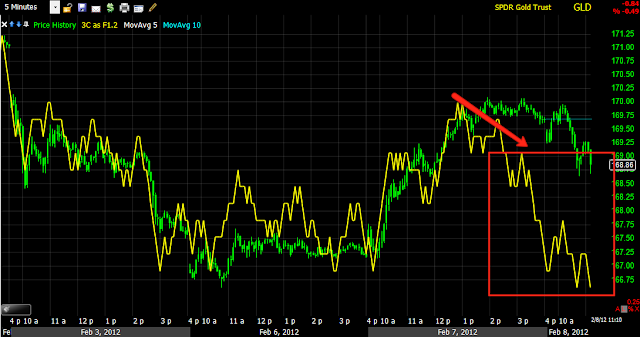
In yesterday's GLD/SLV post, I showed you early distribution on yesterday's move, which was a move up after that channel I pointed out broke. Here's what the 3C chart looks like for GLD and SLV thus far as well as some potential entries.
GLD's daily chart today, although it has lost some ground since this capture a few minutes ago. As I pointed out last week, the consolidation in the channel is pointing the wrong way and as such, was suspect for a break down, as well as GLD being near the large triangle's apex. As usual, after a break we always see the volatility bounce/shakeout, which is rooted in the fact that Technical Analysis books for nearly a century would have you short GLD (at least on a swing trade basis) on the break of the channel and traders do exactly that, so no matter how big the break (whether small like this small channel or a multi-year top), we always see this volatility shakeout as Wall Street uses technical analysis against its practitioners. I really don't understand why traders refuse to adapt as this has been going on ever since cheap online brokers became the rage, it has just been getting worse and worse every year, but if you know what traders will do, you pretty much know what Wall Street will do.
Here's GLD's distribution on the 1 min 3C chart pointed out yesterday, as I said yesterday, it looks like a bounce from the break of the channel and not much more. If you didn't see the timeline below, you might be inclined to think this was a major rounding top-again the fractal nature of the markets.
The 2 min chart looks even worse and is leading negative.
As is the 5 min chart, you already know what the 60 min chart looks like.
Although the trendline is broken, I do prefer a break below the Trend Channel as a very high probability entry. The stop depends on how you treat the trade, a swing trade, a position trade, etc?
If you are using the swing rules and the layout some of you have already downloaded, I drew in a candle to the far right which is below GLD's pivot candle's low of $169.67, that would be the swing entry, but it needs to be on a daily candle that's high does not exceed $169.67.
Here's SLV's daily chart
SLV is also breaking a trendline and saw the same bounce, although the break is not as defined as GLD's
Yesterday's SLV 1 min 3C chart going in to today's open, it is now leading negative. Note the negative divergence right off the open that looked like it was going to move higher, sucking in some longs as it moved above yesterday's close.
The 2 min 3C chart shows a sharp negative divergence on the opening strength.
And there's a large relative negative divergence on the 5 min chart.
Again, I prefer a break below the Trend Channel as a high probability trade, but as always, so long as you figure out your risk management before entering, the trade can certainly be phased in to with a portion entered in this area, giving you a better risk profile and the remainder entered on the break below the Trend Channel, giving you a much higher probability trade.
Here's another candle I drew in for a Swing Entry based on the layout some of you downloaded yesterday, the daily candle needs to see a high that is BELOW the pivot candle's low at $32.70.
Is interest rates about to start going up?
-
Yes, I know - it does not make any sense - FED is about to cut
rates...but....real world interest rates are not always what FED wants it
to be.
6 years ago


No comments:
Post a Comment