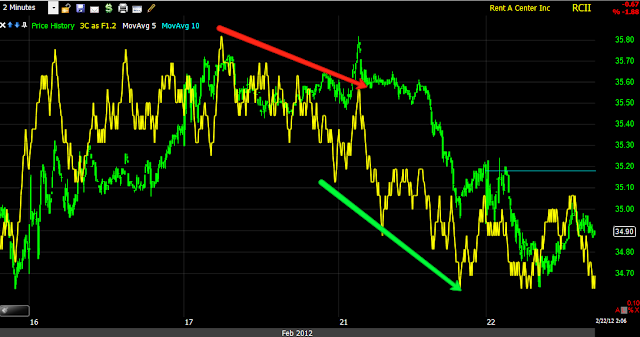
This isn't a very exciting stock, Rent-A-Center, but it looks like a good set up right in this area and the fact that it is not a momentum stock and the momentum crowd isn't in a trade like this, may just have some advantages.
Unfortunately the all of the charts didn't load in the order I wanted, but it's not a big problem.
First RCII has made a break away gap, these are rare in this market, I really don't think it will be filled, which makes this a more bearish trade based on that alone. Next it has formed a bear flag that volume is confirming and that flag is starting to break down.
Here's where RCII being a boring stock has some advantages, as you can see on the last bear flag in 2011, there was no head fake move, it's an obvious pattern that would usually be head faked, but if the momentum traders, which are the primary targets of head fake moves, aren't interested in the stock, the chances and the benefit of a head fake move is severely diminished.
I rarely show Balance of Power because I feel it has little predictive ability, but I decided to show it this time because it confirms the 3C chart and what was going on at various stages.
Money Stream shows a long term negative relative divergence and at the bear flag, a leading negative divergence. Note that BOP, MS and as you'll see, 3C don't show any positive divergence of any consequence at the bottom when the uptrend started.
Here's the bear flag, there was a new high posted just before the stock broke down completely (this may have been coincidental as the market was showing similar behavior on the 26th). It is also showing appropriate volume and a negative candle indicating a reversal of the bear flag is likely near.
Here's my X-over custom screen for crossover signals, there was a long signal when all 3 indicators were green, the yellow areas show price moving averages showing whipsaw or false crossovers as the other 2 indicators didn't confirm, so as you can see, this is a very useful screen if you use any crossover system. The last yellow false crossover though was showing problems emerging in RSI. The sell/sell short signal was clean and confirmed.
For long term trends RCI needs a 5 day trend channel as it tends to get choppy and then post big moves like the gaps down. This channel holds the long term trends well and just broke the long trend at the white arrow.
On a shorter basis of 3-4 month trends, the 2 day Trend Channel works well and this is what I would use as a stop, the uptrend has already been broken here as well.
The long term 3C chart looks very similar to the BOP chart posted above, except 3C quantifies the depth of the negative divergence in a way that BOP cannot. This is extreme distribution.
This is the tail end of the bear flag, you can see where 3C went negative on a little price spike and since then price has been moving down, threatening to break the bear flag in the next leg lower, 3C is confirming the downside move.
This is a trade I would consider in this area, it is not a "show me" trade because the majority of the gains come on opening gaps down. I also think the Risk:Reward and probabilities are favorable in this area.
Is interest rates about to start going up?
-
Yes, I know - it does not make any sense - FED is about to cut
rates...but....real world interest rates are not always what FED wants it
to be.
6 years ago


No comments:
Post a Comment