In doing some reading on another site that DOES have access to a Bloomberg terminal (one day!) they had this to say about today's action,
"as the US day session opened and while construction spending was a bust, ISM managed a small beat. This didn't seem like the catalyst really but we were off to the races as everything rapidly levitated into the European close - except US credit"
Well... IT WASN'T THE CATALYST! So good call, you were right.
As posted as recently as last night and as early as last Wednesday, this is what was behind today's action-from last night's post....
"Last Wednesday and Thursday short term accumulation was noted and I said many times I expected a brief, but impressive bounce along with negative divergences throughout that bounce, much like we saw Monday last week and most of Tuesday before the market started to crack and head lower near the close."
continuing from last night's post....
"Friday we saw the bounce start, except it was underwhelming and the NASDAQ and Russell 2000 didn't participate, this is not what I expected to see, I expected a sharp move, but brief. The only thing that was there as expected was the negative divergence in to the Dow and S&P move as well as ES which started again with that persistent negative divergence (nearly a diagonal line straight down in to Monday/Tuesday's move up. I will say it again, this is rare, especially on 3c/ES."
So today's move had nothing to do with ISM, the cycle was set up last Wednesday/Thursday and was underwhelming on Friday so today's action is in line with what I said I expected to see as of last Thursday. As noted last night, the accumulation period was sharp, but brief, which would lead me to expect a sharp move up, but brief with negative divergences in to it (selling strength), that's what was expected, that's what we got today.
Early today I said that the NASDAQ 100 would need AAPL and the rest of the market to support it and get it off its butt, that happened in AAPL, but on low volume-I finally did take that Put position in April $620's. As mentioned earlier, Friday's AMZN Puts are up, as of the close +65%. I probably should have taken some off the table there, but I was too busy.
As for the charts, lets dig in...
I think this is a bit interesting because last week we saw early weakness in the market followed by afternoon strength as the EU market's closed, we also were seeing accumulation in the major averages around that time. Today that reversed completely and all of the strength was during while Europe was still open and after the EU close, the market drifted laterally most of the rest of the day. The dollar was weak all day, but that may be changing in after hours.
As for currencies...
The Euro is looking here like it's about to break below some support, meaning the dollar is looking like it is about to break above some resistance and since I captured this chart, that's exactly what has happened as the EUR/USD has moved below support around 1.3320
The same dollar strength in after hours can be seen here on the USD/CHF in which the $USD looks like it wants to break above resistance, well since the capture of this chart the USD has done exactly that.

This is a bit longer chart of the $AUD which has been working well as a leading indicator in various timeframes, it is negatively divergence as the SPX is a bit above Monday/Tuesday's Highs, but the $AUD is no where near its highs of the same period last week; speaking of which, the $AUD put out a negative divergence at last week's highs and sent the market lower (at the red arrows).
Longer term, the $AUD has fell out of bed with the SPX as they were once moving together until this divergence started, I take this as a more meaningful red flag.
In after hours, the $AUD is losing ground, since capturing this chart, it has lost even more ground.
This is one of those divergences that goes against the market correlation and this is why we look at these charts, when the Yen surges, the SPX tends to drop, not today and that is because the cycle for the move up was already set up last week, but this is a red flag as the Yen gains ground.
In fact the recent trend in the Yen seems to be turning, which is not supportive of the market and suggests carry trades are being unwound.
Other then the recent climb in the Yen seen here on the USD/JPY pair, more worrisome to locals is that surge in the Yen.
And all of this basically amounts to an expectation to see weakness developing in the market which is happening in after hours and ES (S&P-E mini Futures).
ES has come down about 2 points since the 4 p.m. close and about 6.5 points from the market hours high. Just keep an eye on $AUD/$USD, the more it falls, the worse it is for the market or any gains in general in the dollar.
Commodities intraday hung in there with the market as the dollar was weak all day during market hours.
The recent trend though has been commodities falling out of bed again and this is why I trust HSBC's China PMI more then the official China PMI of yesterday.
Long term, Commodities have not participated in the rally, a warning sign in and of itself, but also says a lot about China.
USO was one of the clear winners in the commod space today, I didn't update it Friday, but the last time I updated it, I said I thought we'd see volatile chop with an overall bearish trend.
Here's what USO's charts looked like going in to the end of last week and today.
USO's 15 min chart has seen a series of negative divergences, still I'm more bearish on Brent then WTI, look on Friday, a positive divergence and right in to the opening lows today.
The intraday 5 min chart shows Friday's positive divergence too, but there was some negative action toward the end of the day.
The 2 min chart shows the divergence too on Friday, the intraday action looks worse here.
GLD wasn't able to accomplish much since the early update, the same with SLV and miners, they even pulled back toward the end of the day, but if you recall, a pullback is what was expected. We'll have to see if there's any accumulation in to that pullback, thus far the signals there are faint and mixed.
Other charts...
This is High Yield Credit Friday, it sold off at the end of the day.
This is HY Credit today, it did the same and sold off during the end of the day. This is what I would expect, a real risk on move would see HY credit which is very cheap compared to the SPX being aggressively bought.
This is the trend in HY Credit, no new high since Feb 6th and divergent with the market and markedly so in the red box.
High Yield Corp. Credit did the same thing, it sold off late Friday and never even got in to the green today, moving down significantly and selling off in to the close.
Look at the divergence between Credit and the SPX on this move!
And the longer term trend, High Yield Corp. looks like it's thinking about making a lower low.
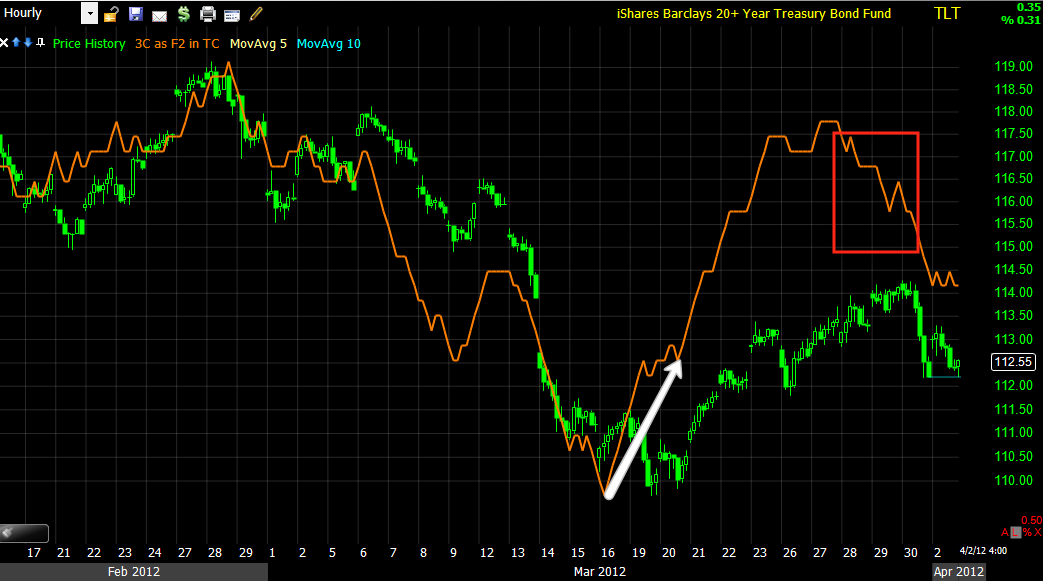
The long bond has been interesting since Friday, there was accumulation at the March lows sending it higher.
Friday it saw a fast dump, since TLT trades inversely to the market, and since Wall Street set up this cycle up, it's no surprise they dumped TLT on Friday and hard, the negative divergence (intension) was there, but not so surprisingly, a pretty solid positive divergence formed in TLT today, which makes me wonder if we are done with this move (I never thought it would be much more then 2 days, although Friday was weak so I'd be willing to give it half a day tomorrow).
The 5 min chart is even leading positive, so accumulation in Treasuries, distribution in equities, it adds up.
The Vix finally was interesting today, it gapped quite a bit higher then I would have expected considering the market's open. Note right at 12 after the EU close (the same time stocks lost momentum) the VIX trended up and closed green today, despite the market closing green and pretty strongly, again, this would fit in with the entire quick, but sharp bounce that sees distribution theory I've been working from.
As far as internals go, there was no single dominant Price/Volume relationship today, but it was heavily skewed toward price up, whether on declining or advancing volume, which can often create that 1 day overbought event which can be part of a larger reversal.
As for the NYSE/NASDAQ, today was lower than avg. volume (NYSE 763 mln, vs. 805 mln avg; Nasdaq 1720 mln, vs. 1735 mln avg), with advancers outpacing decliners (NYSE 2257/757 Nasdaq 1762/767) and the ratio of advancers/decliners is pretty strong as well, which is also often a sign of a 1 day overbought condition, especially on lower then average volume.
Finally what I think was probably the event of the day, the F_E_D's Fisher on CNBC says he thinks they ought to sit, wait and watch on policy;
says he's not willing to support further accommodation, either through further QE or operation twist .
Fisher says the recovery isn't quite strong enough to talk about tightening.
I'll keep an eye on currencies and ES and bring you updates if warranted.


No comments:
Post a Comment