In a previous update (I believe of Tech and PCLN), I mentioned the holding pattern the market was in with some looking better than others and mentioned that it might take an extra kick from Wall Street to get the market moving again, it looks like that extra kick came. The difficulty now is that the averages are approaching or in resistance areas and the $USD did NOT weaken, in fact the market is moving against a stable $USD, which looks like further evidence that Wall Street did actually chip in the ante needed to break the holding patterns.
The DIA is a unique case, other than the Russell 2000, the Dow has the strongest price performance, which also means it is in the best position for selling in to strength and it appears that is underway. Here's a fairly bullish ascending triangle-as I said, some consolidations looked better than others. My concern here is this pattern is VERY obvious, the Dollar is not supportive and we are running in to resistance areas. This is not the strong environment that would produce a more stable trend.
DIA 1 min saw a negative divergence right on the open and has been in a leading negative position since. This is only a 1 min chart, but it seems to be a clear signal that strength is being sold as it should.
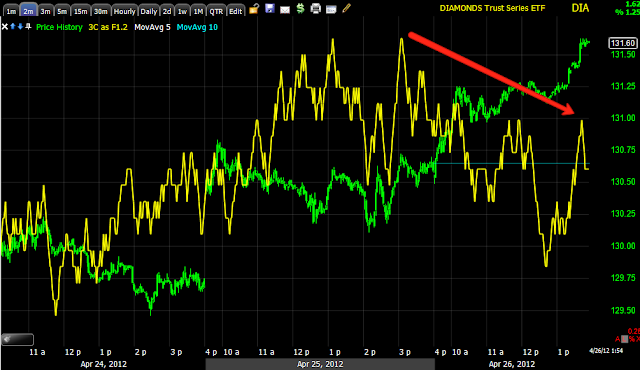
The 2 min chart here is looking pretty negative.
The 5 min chart, while moving in the same direction, is lagging pretty badly here, this puts this chart in a leading negative position as well. I also don't like this parabolic price movement, again, the underlying conditions in the market are not stable, parabolic price moves are inherently unstable.
The 15 min chart which is where we should see the final signals is moving in the right direction like the 5 min, but from previous bounces and the distribution in to them, the DIA as well as the rest of the market, started this bounce from a weaker position (in underlying trade) than any of the previous bounces. In fact each bounce has steadily deteriorated the underlying trend in the market.
The QQQ was the weakest consolidation.
Unlike the DIA which was already performing well price wise, the Q's were not, they need strength to sell in to, the DIA offers that, the Q's didn't, so it looks like they stepped in with some support as I mentioned earlier they may have to as to keep this bounce alive as it face mounting headwinds. The 2 min chart shows a clear intraday positive divergence before the Q's moved up.
The 5 min chart is at price trend confirmation, but also at a resistance area from yesterday afternoon.
Remember that we saw the Q's and Tech would rotate in BEFORE AAPL announced, that was based on this 15 min positive divergence, it is still looking good here and is actually leading compared to the 19th.
SPY also with a reasonable consolidation
The positive divergence to get the SPY moving is seen here on the 5 min chart.
You may recall the SPY's strength for this bounce came on the 23rd when 3C refused to move lower with price, creating a leading positive divergence, so far it remains in line, but is looking very wedgey.
The 15 min is lagging in the SPY, this makes some sense as it was Techs turn to rotate in. It's not at a red line position as of yet, but we have seen these 15 min charts turn in an hour. So far though, the higher targets I had set in last night's post look like they are still on track.
Is interest rates about to start going up?
-
Yes, I know - it does not make any sense - FED is about to cut
rates...but....real world interest rates are not always what FED wants it
to be.
6 years ago


No comments:
Post a Comment