A few posts ago I talked about what I thought could happen on a market bounce and the reasoning behind why a strong market bounce would occur along with increased volatility which would be needed for the market to do what I suggested I thought would be the most likely outcome from here. If you need the post that I explained it all, let me know and I'll find the link.
I also said I didn't have the evidence yet to back up what I thought would be the most likely outcome in the near term, that evidence is starting to 'accumulate", pardon the pun....
The 1 min DIA chart is messy, but there's a relative positive divergence in place and a bit of a leading divergence as well.
The 2 min chart is cleaner, the leading positive divergence is clear,
That 2 min strength is moving to the 5 min chart.
ES is showing a positive divergence, it is not leading, but it is there.
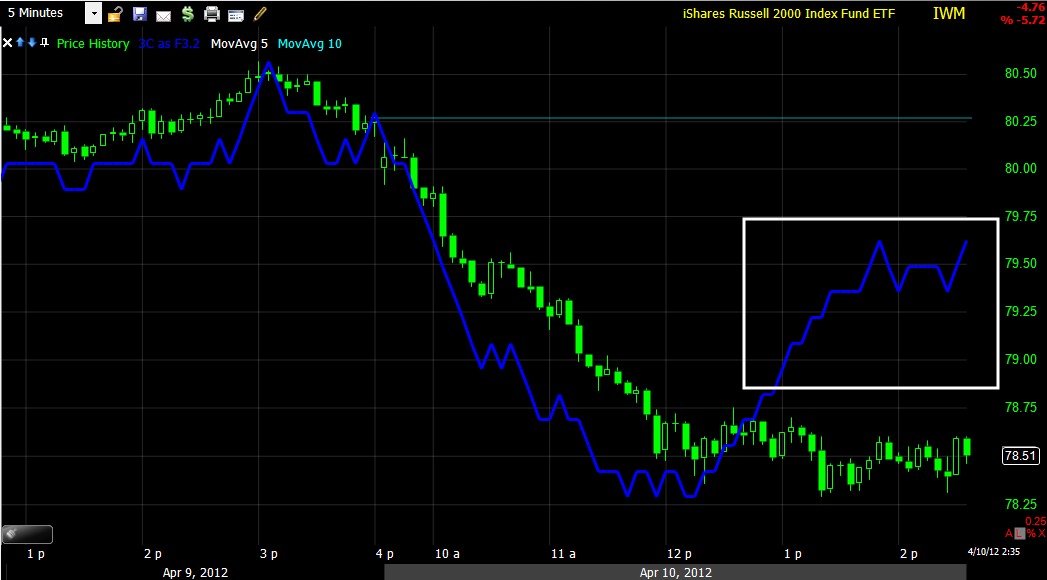
The IWM is showing a clean 1 min positive
A clean 2 min leading positive
And that has moved to the 5 min chart.
The Q's 1 min are a bit sloppy too, but the relative divergence is there
The 2 min is much cleaner and starting to lead positive
The 5 min is simply in line with price.
SPY leading 1 min positive divergence
SPY 1 min relative and leading positive divergence
The 2 min leading positive is clean and clear.
And we are starting to see the 5 min accumulate.
The only thing really missing is a strong head fake move. I would suspect this will cause a bounce that will easily run in to tomorrow.
If I was VERY aggressive and VERY nimble, I might even consider a leveraged long ETF or options, but that is VERY aggressive. I prefer to take the short trades and short in to strength to set up the next one so when that crack comes in the market, I'm never on the wrong side of the trade.
This is now shaping up to look like a decent bounce will materialize. Just remember, these are meant to cause you doubt, to mess with your head and cause you to make emotional decisions. Just try to remember the leading negative 3C long term charts and trends as well as the risk layout divergences I showed earlier. Remember to expect this kind of volatility and don't let them get in to your head. It was just last week we saw the SPX make a new high for the rally and look where we are now.


No comments:
Post a Comment