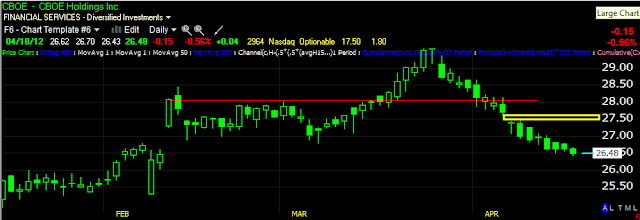
When I throw out a bunch of trade ideas it doesn't mean you should be trying to take them al. I usually have a set of circumstances I'm looking for to happen that would make the trade worthwhile. This is the difference between chasing trades and letting the trade come to you on your terms. Thus it is best to have a watchlist of the ideas and set price alerts for the key areas in which we are looking for something to happen that would set up a low risk/high probability trade.
CBOE at first looks like a long shot, looking a bit deeper, it may not be as much of a long shot as it appears.
CBOE has a strange, undefined top formation, but there seems to be a clear resistance level that was broken. There is a gap right around $27.50, the concept here is simple, CBOE looks oversold compared to the market and the market rarely leaves gaps open, so the target area is the gap at $27.50.
The daily 3C chart with distribution in to a somewhat parabolic rally and the typical end of a parabolic rally, the decline.
The 60 min chart is negative, but within that leading negative divergence there's a smaller positive divergence, this is what gives the trade a chance of making it to the gap.
The 30 min chart showing selling in to the parabolic run up and a positive divergence here.
The 15 min is the same, look for CBOE to rally in to that gap, we can take a closer look at it if it gets there, should there be distribution in to the gap, we have ourselves a likely trade.
Is interest rates about to start going up?
-
Yes, I know - it does not make any sense - FED is about to cut
rates...but....real world interest rates are not always what FED wants it
to be.
6 years ago


No comments:
Post a Comment