I think we have had a great run over the last few months, we knew we had volatility shakeouts to go through, we knew they'd be sold, we knew what the targets roughly were for a move that hadn't even started and we hit them on the nose. We also knew that the market was going to get much more volatile, much more erratic (The everyman for himself behavior among smart money) and that in the end this move fails.
I think we have had some amazing calls, take yesterday's call and target for today! I know people like the guru mentality, they like to hear certainty and when I've had some tough calls to make, I've made them and stuck by them. I know our membership is more sophisticated then to fall for the "Guru" mentality which is nothing more than always sounding like you are sure, even when you have no idea. That is why I feel comfortable telling all of you (and I think you deserve the honesty), that I can't be certain this is the top, I can't be certain that it isn't. So I'm going to give you everything I know and how I feel about it, it may be contradictory at times, it may be confusing, but it is the data.
I think this is the first time I have felt uncertain enough about the next 2 days that I have ever said anything like this. The issues are the following:
The heard-like behavior of Wall Street that 3C is so good at picking up on because they buy and sell all the same stuff, is breaking up. AAPL's price action is one of the biggest signs of this, the reason is simple-FEAR. If you have a job that pays hundreds of millions or even billions and you know what's coming, you are going to take any chance you get to get out of the way and in position, after all, keeping that job is the most important thing. So we are seeing ALL strength sold, the past few bounces we saw "selling in to strength", but it allowed them to sell in to higher prices. Now we have hit the target levels, the selling is strong enough that it can over run short term divergences, again AAPL is the best example.
Next, our targets have been met. Last night's target for the market today couldn't have been any better,
see this link. Because the targets have ben met, the strength in the market was present to allow smart money to sell in to strength or short it. The herd is breaking up and while higher prices would be best for everyone, Fear is strong in fund management so, "He who sells first sells best". The idea of the market swinging way beyond what it should (which we predicted weeks ago and it has) is what the market does and can still do, but the Fear among managers is making that more difficult.
The 3C signals that developed so well yesterday while the market was down that it was a fairly easy call that we would see the market up today. The target level was an easy call because that is where smart money needed the market to pull off their plan. Today there were some signals, but they were very late in the day and very new on very short timeframes, meaning they could easily be simple jiggles in 3C, they could be positive divergences as they appear to be to take the market higher, or they could simply be run-over as fund managers do what they need to.
While there are enough divergences to make an educated guess, there are also some key areas where they are not to be found.
Finally the things that I said, I expect to see X, Y and Z happen" have for the most part happened, there are a few key areas where they are yet to happen and this is also part of the visibility difficulty.
Here's and example just from a Market Update today...
"DIA 5 min shows a slight negative, but mostly still in line, so I'm sticking with the "U" shaped reversal rather than a "V" based on what I see, but when the reversal does come, the "U" shape should be sharper than usual, more of a parabolic curve."
Now today's action...
This is about as perfect an example as I could even hope to see, a "U" shaped top, but much sharper than usual. That's hard to argue with.
How about our target? The target was a new high above Friday's SPX $1400+. This is the target needed to draw in the bulls for a bull trap.
The upside target was hit, the only thing better would be a close up there, so we still can't preclude that from happening, it would be much more effective as a bull trap, but the hedge fund managers aren't as interested in a bull trap as they are making sure they are positioned and keeping their job.
So on one hand we have the known market concepts of the bull trap, extreme volatility as we have measured volatility and see it more than double, the pendulum effect, etc. On the other hand, we knew it would get more chaotic and less predictable as we reached this point.
I've been looking for 1 final move in AAPL, something like this...
We knew since April 10th that AAPL would underperform the market on the whole, we knew April 24th whatever AAPL's earnings, Tech and AAPL were going to rotate in the next day. However I have expected 1 final shakeout in AAPL up around the white price candle I drew in. Volume was huge on the downside as the market was trying to bounce, all of the hedge funds were trying to squeeze out of the same door and this is exactly why I though AAPL would underperform, but I did expect it to rotate in at the very end. Volume has been lighter on the last 4 days and AAPL just about put in a "Tweezer Bottom" short term candlestick reversal today-only off by 3/10 % today.
So lets jump in to some charts, I'm going to give it to you straight as I see it, but I think no matter where the exact top is, we have been hugely successful in our analysis of first what this formation over the last 2 months truly is ad that is a very bearish top and I think we have had great success in not only identifying the areas to sell/short in to strength, but have had some great options trades from 7% to 244% over a period of a few days.
These are the areas we have identified as distribution points to sell/short in to, the break of the 50-day ma we identified as being the spring board for this last bounce.
Stepping back, a break of the October low is not at all unreasonable, so look at where we have been shorting, I think we can call that a success.
As for the charts, good, bad, bullish, bearish and ugly, here they are.
The DIA shows Monday's positive divergence clearly, the call for a move up today wasn't that hard. On the other hand, I don't remember ever seeing such intense distribution (3C negative divergence) right at the highs in a market that wasn't in the process of failing.
While the 15 min chart is plenty enough negative to reverse this market, I have sen sharper divergences before. All in all, the DIA charts taken alone would suggest the bounce is over.
Then the IWM 2 min chart jumps in and muddies up the water. We have the same very intense negative divergence (distribution) today, but at the end of day we have a relative positive divergence that might have been easy to dismiss as just lagging a bit if it had not ticked up in the white box at the close.
The IWM 15 min chart (this timeframe is very useful for reversal timing) is plenty negative to take the market down, relative negative and leading. IF I had to guess looking at the IWM chart alone, I'd say 50/50 we see either some move to at least $18.40 or higher .
QQQ's positive divergence from Monday, pretty sharp intraday distribution, but a relative positive divergence at the close that also ticked up.
The 15 min is negative enough here, it is way more negative than some past reversals, but we knew this time would look worse than anything previous. Based on the April 24th accumulation and the size of the negative divergence, I'd lean pretty heavy toward a tech rotation to finish out this cycle/bounce.
Like the DIA, there's no sign of a positive divergence anywhere in the SPY, the strongest looking chart for today is deeply leading negative, look how quickly it happened too once we hit the intraday highs. It's common sense, but Wall Street needs some gains to distribute in to, they got them today.
The 15 min chart is negative enough, especially with today's parabolic move sticking out, but this chart could be worse, it could be deeply leading negative. If I had to guess based on the SPY chart alone, I'd say the market was going to pullback in to some short term accumulation and make a final blow-off top move.
Some Stocks and an AMZN Trade Idea...
AAPL is ugly just about everywhere I look, there was clear distribution on today's early strength, the intraday support levels failed, again, I think hedgies are just selling wherever they can, forget about best price, just get out of the way. So what to make of this end of day positive divergence on a 3 min chart? It is leading and we do have something pretty close to a Tweezer Bottom over the last 2 days... I'd normally say AAPL will move higher from this divergence, but we aren't in normal times. Maybe this builds out laterally or on a slight dip to a stronger divergence for that move I expected, or maybe it's just an early small divergence that gets mowed over by panic.
AMZN beat on earnings, the internals of the earnings weren't as great as price suggests. The 5 day chart below shows several key short covering areas taken out.
The market has been VERY diligent about filling gaps, also with the market tide going out, it will be hard for any stock to buck the trend. The last 2 days have formed a Harami Reversal or what the Japanese call, "Mother with baby" or what we call, "An inside day" in the west. Either way, the ideal short set up based on the Harami pattern will be a gap up open above today's high and that same day to close at least below today's open, but the deeper the better, this would be a confirmed reversal signal and the gap up would offer excellent, low risk short positioning. If the trade will come to us, why would we want to chase it and sit through draw down and opportunity cost? There are too many stocks out there that will come to us.
AMZN 3C charts
The 1 min looks like AMZN earnings were leaked on a positive divergence before the gap up, there's also a positive divergence today, this could be the start of that gap up I'd like to see as a short entry so long as 3C confirms weakness in the gap move.
Longer term there's distribution in AMZN as this is an easy sell at these levels.
5 min divergence leading negative-note the positive divergence before earnings.
The hourly has a relative negative divergence. Keep AMZN on your radar, maybe set some price alerts for a gap move higher so you don't miss it.
BIDU-I have a profitable position started here, this is a great example of having a trade plan and being patient and executing the plan as the stock comes to you. We had fantastic head fake signals in BIDU before the head fake even came-we knew in advance exactly what BIDU would do right up to this day.
As Tech stocks go, BIDU, which I'm hoping to add at higher levels, has several positive divergences, I know this is a bit confusing, but the 12:30-2 p.m. positive divergence could very well still be intact and instead of being run over, BIDU simply did what 90% of stocks will do and moved with the market, even the close left it in a relative positive divergence. It's stocks like this that cloud the short term with so many extreme and mixed signals.
BIDU 15 min has a large enough positive divergence to put in more gains from here, the negative divergence is rather small. So if BIDU rallies, what does that say for the market? Few stocks will buck the gravitational pull of the market's direction.
PCLN, another I have a short position in the equities model portfolio.
The 2 min chart today has a pretty clear positive divergence.
So does the 5 min, it's actually leading positive (which is always stronger than a relative positive-leading divergences are in a box, relative are marked with arrows). The area of 3C has nothing to do with a price target.
The short term looks like PCLN wants some more upside, the 15 min chart is clear in the distribution in the trend. PCLB finally looks like a short, but we just saw several tech stocks all with positive divergences, the QQQ and IWM had positive divergences as well. Maybe (and I really mean that) we will finally see the tech rotation that includes AAPL
Other charts...
TLT a a safe haven trade saw distribution yesterday afternoon, the bounce today was pretty well understood to be coming by Wall Street, and of course us. There's a leading positive divergence in TLT which would suggest a move higher on a market move lower, however I'll add one thing objectively, I would think TLT would accumulate longer considering the market move we are expecting, so this could be the start of accumulation in a base that will be larger or...

VXX, featured Sunday night looked like both the very short term and the longer term were bullish, thus far the first half came to pass as VXX gained yesterday on market weakness, note though how strong and how fast they took those profits, again, Wall St. knew what was coming today. We have some accumulation, but there's some end of day weakness in that accumulation. Since VXX trades opposite the market, could it be that the end of day weakness corresponds with the late day QQQ/IWM and tech stock positive divergences forming? In a rational market (which I think has been turning but really went out the window today), that would likely be my assessment. The hedgies will stand down on selling if they see strong participation by AAPL and give the market a little breathing room.

VXX 5 min is a longer term trend than the 2 min above, the difference can be a day -2 min representing tomorrow, 5 min representing a bigger trend starting Thursday. In any case, the accumulation in this short term trading vehicle suggests again the market is in for a big break to the downside.
VXX 15 min showing a "W" base nearly complete with the kind of positive divergence used to confirm such a base. Being VXX trades the opposite of the market, this isn't good for the market's trend.
Energy- Yesterday I said I expected Energy's strength to rotate out, amazingly and a display of Wall Street's ability to manipulate a market, Energy traded against the currency correlation.
The intraday negative divergence, into strength, looks really bad as a leading negative divergence.
5 min is the same, they really used today's price strength to sell/short Energy.
The 15 min has a good size relative negative, if there is a market move higher and $USD cooperation, Energy certainly could move higher, my gut feel is it would lag and thus XOM is the only short I added to today.
XLF-Financials
The 3 pillars the market need for a strong rally are Tech, Financials and Energy. If Tech does continue the rotation started on the 24th, and financials move with it, we could have that closing move higher in the SPX and maybe the move in AAPL. Although the selling of Financials was clear today as they hit their highs, this is one of the cleaner positive divergences today, remember it does contrast with the DIA and SPY.
XLF-Financials 15 min, it's negative, it could be worse, but enough to turn the market, I was expecting worse though on the market turn, so once again, more mud for the water.
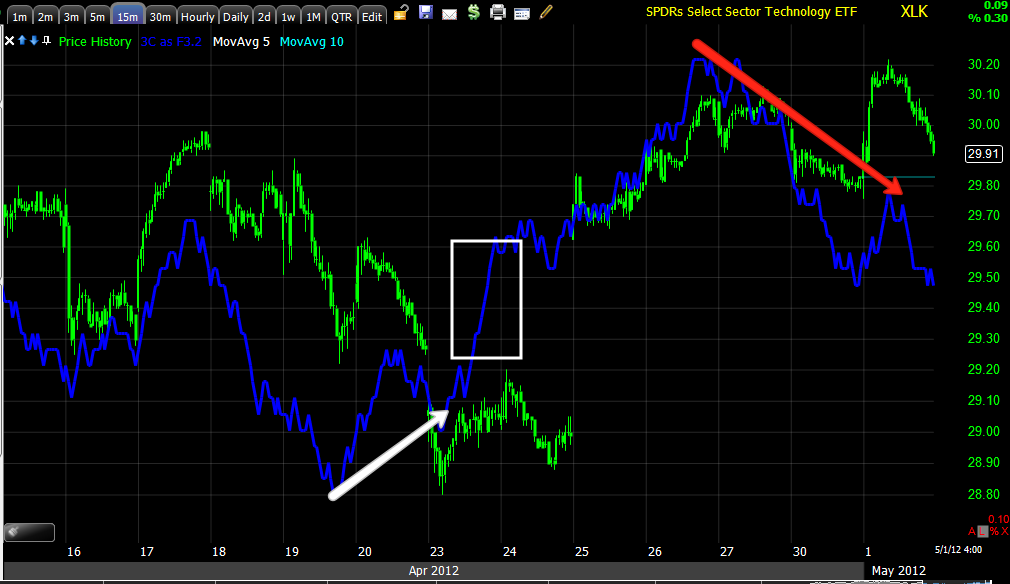
XLK-Tech
Selling in to the intraday highs was very strong, there's a clear positive divergence end of day though, this fits with the Q's the IWM and several of the few tech stocks I showed you.
Longer term, since we identified the Tech rotation on the 24th, the distribution has been solid, especially in to today, so the longer term trade is falling apart as expected.
Currencies...
The Euro 1 min trend, I mentioned the Euro was weaker today then many of the risk on assets that are typically very well correlated to the Euro, note the distribution on the head fake move higher o the open today.
A little longer intraday chart shows a positive divergence and a leading one at that in the Euro, a move higher in the Euro would almost certainly result in a move higher in equities.
Although the 5 min chart catches distribution at all the right places, overall we have a pretty solid positive divergence, even though it is actually in leading negative territory in the trend (the trend effects the longer term outlook, this positive divergence is more day to day tactical moves).
Speaking of the longer term trend in the Euro, the 15 min chart is pretty clear on that subject. This matches up perfectly with out market expectations as the bounce ends.

This is the manipulation of the market I talked about, here we have a near perfect inverse relationship when in reality the Euro in orange and the SPX in green almost always move together. This means they lifted the market despite $USD strength. What I wanted to show you though was the positive trend chance in the white box as the market headed lower, considering there were some positive divergences as this happened and considering the Euro short term charts, again it is difficult to rule out further gains. To be fair and honest, there's a chance the positive divergences developed because they saw improvement in the Euro, but I think it not likely being that some of the divergences are longer than the Euro move and unless they knew the Euro could hold that move overnight, there would be no sense in accumulating at the end of day with the European market's opening Wednesday. I do have to point out the short term positives in the Euro ETF.

This is the Euro vs the SPX over a couple of months, when the Euro tends to diverge form the SPX we get reversals, there's one in red as the Euro wouldn't make higher highs with the SPX, there's a positive at the white arrow as the Euro was trending up as the market was chopping sideways and then there's today's. This is clearly enough to turn the market, but if the Euro strength bounces back for a day or so, the market isn't going to turn just because there's a divergence between prices.
UUP-Proxy for the $USD
The dollar trade up early and sharply and saw a negative divergence which kept it flat most of the day, there's a little late day weakness that fits with the Euro late day strength, the 3 min 3C trend here seems to be leading negative, suggesting the dollar loses some ground, the Euro should gain on that and the market should get some breathing room.
UUP 5 min (longer) trend shows the same leading negative divergence.
Longer term though there's a decent positive divergence developing, $USD strength causes stock market weakness.
Risk Asset charts....
High Yield Corporate Credit which has been a really cheap way to play the market bounce and has also been on its own shakeout move of a multi-month downtrend (a good time to point out that credit leads and equities follow). The trend here although not perfect is roughly in line, I would expect to see a strong divergence between HYC Credit and the SPX at a turning point, especially with this volatility.
Commodities ignored the $USD strength today and rallied, note the positive dislocation to the upside in commodities toward the end of the day vs the SPX.
If you have any doubt about where this market is pointing to, just look at the divergence between commodities and the SPX, or Credit, Rates, 3C, currencies, etc. This is why I believe the October lows aren't an unreasonable area to see the market break below.
High Yield Credit hung in there with the market today, once again HY Credit, like HYC credit is at a severe discount compared to stocks and a nice way to play the bounce. Again, I'd expect Credit to look a lot worse at a reversal day.
Yields which are like a magnet for stocks, hung in there today, at past downside reversals this has been negatively divergent.
Here you can see what I mean as the SPX tried to bounce, but Yields didn't share the SPX's excitement and the bounces failed. Over the longer term trend, this is a nasty divergence, much worse than any seen this year and tells us how close we are if not already there, to a market implosion. However, the short term chart is still in line with SPX intraday action. Just like 3C or really any indicator, the more timeframes that are aligned in the same direction, the stronger the signal.
That's about all the charts that I have for you without putting up 50 different stock charts. I purposefully have not looked at ES or the Euro while I put this analysis together which has taken nearly 5 hours now. I'm going to look at them now as I didn't want them to influence my analysis.
Before I do, I'll say although I don't feel we have a lot of strong signals all pointing the same direction like we did yesterday, my opinion is probably best observed through my lack of adding to short positions today, only XOM. That's my gut telling me this market is volatile and choppy and I feel more strongly at the end of this post than I did at the start that probabilities are for some more gains, whether that happens tomorrow or in another day, I can't say. I also have to say this is the most difficult call to make all year so I certainly can be wrong, but that's my opinion-we're allowed to be wrong once in a while.
Now for ES and the Euro...
The Euro since the 4 pm NY market close, the Euro clearly lost some ground and has been a bit choppy.
Here's today's 9:30 open to the 4 pm close and until present, as you can see the Euro was week today so the fact we had a rally tells you something about Wall Street manipulation. Being the Euro is somewhat choppy since the close, I'd expect to see similar action in ES.
However the choppy action isn't there, ES is VERY stable, 3C is in line. Not what I expected later seeing the Euro.
Well we'll see what happens soon enough with Europe opening in 2 hours. I'm sorry this is so late, but it's taken quite a long time to research and put together as I'm looking for any edge I can find in a muddy market.
Given the look of the SPY and DIA on the close (3C) I would say that the market would either have to pullback and/or consolidate to allow them to get a positive divergence under them before moving higher, or the second option (barring an all out decline in the market), would be they aren't putting anymore support money out there and would rather try to manipulate ES overnight and gap the market up-those are my most likely upside scenarios. We could just break down from here, however after looking at and explaining all of the charts, I'm leaning toward "This isn't quite done" which I would like so long as I can add to positions like BIDU and AAPL.
Have a great day tomorrow.


No comments:
Post a Comment