XLF 2 min intraday-when looking at a suspected pullback (vs a change in trend), we look for positive divergences in to lower prices that let us know that the shares are being bought at lower prices, this is highly suggestive of a corrective or tactical pullback. In a trend reversal we would not expect to see positive divergences, but rather leading negative or in line readings. Since the pullback started, there have been positive divergences in Financials on the 2 min intraday trend; today makes a new leading local high.
The 3 min chart showing the pullback signal and the same positive divergence in to the pullback.
The 5 min chart is for the most part, in line. It seems the 3 min positive divergence hasn't made it to the 5 min chart yet. My gut feeling is that there's more downside in the pullback in which we should expect to see stronger positive divergences in to lower prices.
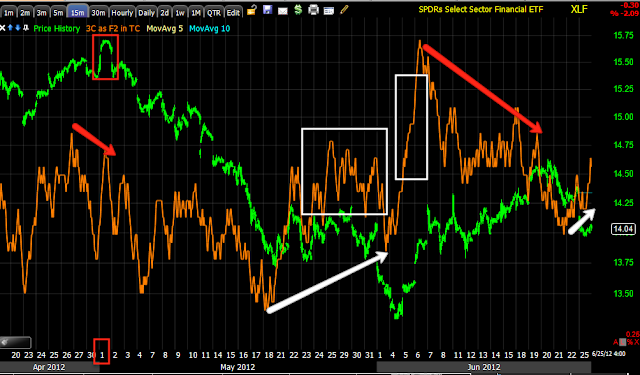
The 15 min trend since the May 1 top showing a positive divergence in the bear flag/pennant and at the bear trap break below that pennant that sent prices higher. After that a negative divergence, part of the pullback signal. I believe this negative divergence was stronger than would normally be seen because price in the SPX was above major resistance which would have caused short covering. To create a pullback while dealing with short covering, I believe smart money would have to lean on the market (put more pressure on it) to create the pullback. There's not much reason to create a pullback when you are already in short covering territory unless you want to trap more bears and create a stronger short squeeze. For example...
Looking at the SPY, there was a top in place.
A) A break below the top would have brought shorts in to the market, after the initial break a bear flag/pennant formed. Traders view this as a consolidation/continuation pattern and expect the market to break down creating a second leg down from the point of the break below the pennant that would have had a target of approx. $118.
B) Part of a Crazy Ivan shakeout ( a shakeout in both directions) not only would have caused some shorts to cover (creating trading profits as well as volume rebates), but the failure of the breakout would have confirmed in bears minds' that a test of resistance failed and it is safe to short the SPY again.
C) Price breaks below the pennant as traders expect, they have confirmation and many will wait to short the SPY until they have price confirmation (chasing). That move quickly was revealed as a bear trap, 3C signals warned we would see such a move weeks in advance. Shorts would start covering as price moves up.
D) The SPY once again looks like a failed test of resistance, another favorite area for traders to short the market.
E) The SPY breaks through resistance causing shorts to start covering.
F) The break below support (former resistance) once again gives shorts confidence in shorting the market again.
The market makes money by making as many traders as possible wrong at any one time. There are at least 5 major moves described above that would have had traders on what they perceived as the wrong side of the trade and those are just the major moves. This is one reason I'm hesitant to short initial breaks from important tops, the volatility shakeouts are just too extreme; Rather we started shorting the market while traders were still bullish in March on 3C negative market signals, as a result, none of the core shorts have been stopped out and all 6 core short positions are at a profit of up to 25% using no leverage. This is the difference between chasing the market (which is what Wall Street wants) and using your greatest advantage over Wall St., your ability to pick and chose when and where you are in the market and let the trade come to you.
Carrying on with Financials...
The 15 min chart close up of the reversal, we are now starting to see accrual of positive divergences now show up on the 15 min chart as it is starting to lead in positive position. I can't tell you how many Titter messages have been forwarded to me of traders entering the market one day and being stopped out the next, over and over again.
Thus far, financials look very much like they are in a pullback rather than a trend reversal. As mentioned above, I believe the reasons are more tactical than anything else, "make as many traders wrong at any one point in time" and we have seen numerous smaller patterns set up that appear to be bear traps as well, we reviewed several of them today.


No comments:
Post a Comment