For newer members CONTEXT is an amalgamation of different asset classes modeled together to give an idea of what the fair value of ES should be and compares that against ES.
Our risk asset layout is kind of similar in that it contains many indicators that have proven to be excellent leading indicators and have helped us pin point many reversals or confirm a trend, it is just more specific than CONTEXT. Today's readings thus far are not extreme, meaning we aren't getting a good signal one way or the other, there has been recent deterioration in High Yield credit markets that have been of interest lately. Altogether, today' update is kind of blah, it may change as the day goes on, but seems to indicate the market sentiment right now of a wait and see attitude coupled with some de-leveraging. There are of course a few areas that buck that overall trend.
Commodities vs the SPX (SPX is always green unless otherwise specified) intraday, commodities are showing unusual strength in to dollar strength, Euro weakness. I haven't looked at all of the sectors so I'm not quite sure where it is coming from.
To the left on June 14th commodities were behaving as expected vs the $USD correlation ($USD green), recently however commodities have been trading against that legacy arbitrage correlation, Friday it made some sense with all of the chatter about Central bank easing possible today should Syriza have won the elections, Friday gold and oil to a lesser extent were trading up as they would benefit from easing, today that's not quite the case, I'm not sure why commodities are trading with the $USD.
GLD today is near unchanged and slightly in the red.
Commodities vs the Euro (green), the correlation to the far left is the normal, Friday it started to fall off a bit, today commods are trading exactly opposite of their normal correlation with the Euro, perhaps there is some Central banking easing sentiment in the market still.
Commodities vs the SPX longer term, commods gave a positive signal at the SPX lows to the left, they kind of fell out, but commods have been underperforming all year and then some. Recently they look like they're trying to jump back in to correlation as a risk asset with the market, yet they still have some work to do.
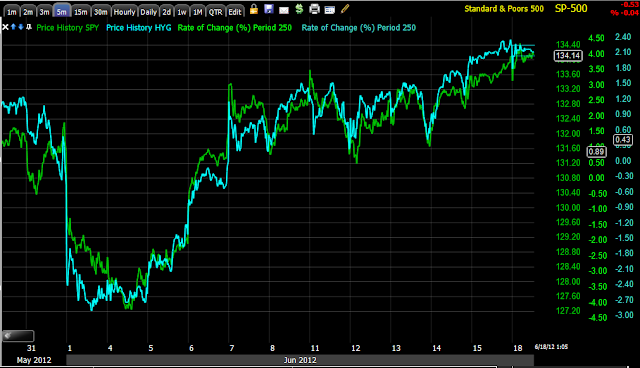
High Yield Credit, which is a risk on version of Credit and credit often leads with stocks confirming or following, has been ugly lately. Today HY credit is somewhat in line with the market intraday and has an upward bias, it will be interesting to see how it closes, however....
on a longer term basis, HY credit has fallen out of bed with the SPX, which is typically a negative sign for the market. To the left credit started trending up while the market was hitting its lows (a positive divergence), it stayed in line and then started to flash some warning signs, now it is quite ugly, it does however conflict with High Yield Corp. Credit.
High Yield Corp. Credit is a bit weak intraday, you may recall last week I was a little concerned that the move in HYC credit may be more about the longer term channel it is trading in.
On a longer basis, HYC credit is in line with the market, if HY credit looked the same we'd have good confirmation of the market trend, as it is now, HY credit is sowing the seeds of some doubts.
Much longer term, the downtrend in HYC credit was one of the warning signals that got us selling the market short on strength during March-May 1st as the market was in a lateral top, but credit was trending down. The recent concern I had Friday about HYC credit's position is that it may be more about this longer term channel than near term confirmation as HYC credit trades up to the top of its channel. We could still see a head fake shakeout move as we have seen two already (one to the upside, one to the down side) at the yellow arrows.
Yields tend to act like a magnet for equities, today they are pretty much in line with the SPX.
However recently longer term they have fallen out of sync, to the left you can see how they led the market as the SPX was making its regional lows.
$AUD is one of my favorite currencies as a leading indicator, today in the afternoon it is behaving pretty well.
Longer term it is in line with the SPX, you can see both negative and positive divergences in $AUD to the left that led the market. Right now it is in confirmation, as a few other indicators are, but credit is still bothersome.
The Euro vs the SPX today, there's that downtrend I mentioned earlier in a near term Euro pullback. The market is a bit more resilient than I would think given the Euro's weakness this week.
Longer term the Euro has also acted as a leading indicator, today it has fallen out of sync with the SPX.
Energy's momentum vs the SPX is off quite a bit today
Financials were in line with the SPX, but have since seen some relative underperformance intraday (momentum).
Tech is a little better than in line.
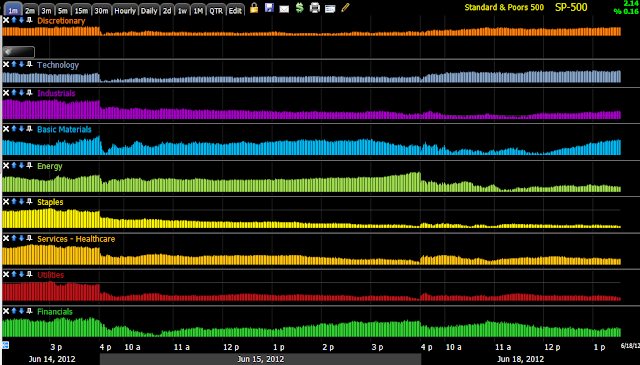
Sector rotation (vs the SPX), clearly you can see the de-leveraging of risk Friday that I mentioned as we moved in to an uncertain weekend with the Greek vote.
Today Financials are losing a little momentum, the safe haven assets are seeing a little momentum (Healthcare, Staples, Utilities), Energy as mentioned is way off, Basic Materials interestingly are picking up, Industrials aren't doing much, Tech is also picking up and Discretionary. All together though, it's still a bit bland, but Basic Materials and Tech have some good momentum stocks within their sectors, so that's interesting intraday.
Hopefully the closing readings will shed more light.
Is interest rates about to start going up?
-
Yes, I know - it does not make any sense - FED is about to cut
rates...but....real world interest rates are not always what FED wants it
to be.
6 years ago


No comments:
Post a Comment