I don't know if that correlation would hold up over the long term, but gold is definitely a sentiment indicator for more QE (gold rallies when easing looks promising and sells off when easing looks distant), take that to the next logical step and the only reason the market hasn't fallen in to a black
hole by now is because the market is still "hoping" for central bank intervention/easing, so in a way, gold could be seen as a leading indicator for the market and that's one of the assetsI was looking at today before we had any clear signals in other places, GLD reacted earlier.
The market is fractal in nature, what occurs on longer timeframes also occurs on shorter timeframes. You can see several instances above of gold lading the market by either topping or bottoming first. Today GLD was much less enthusiastic than the SPX.
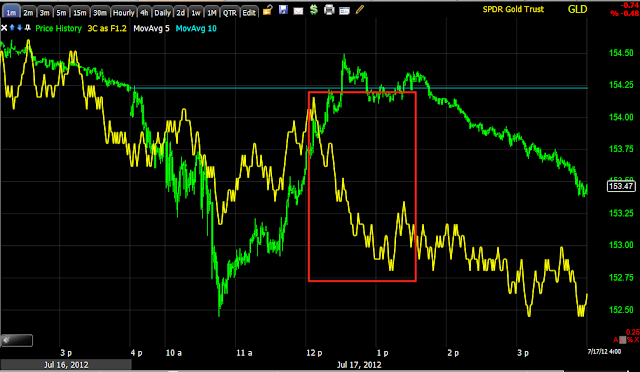
Earlier today we identified negative divergences in GLD and suspected it would move down, taking sentiment and hope down with it, by extension, the market.
This is what the 2 min chart looked like around the last time we looked at it today, leading negative, price followed.
The 3 min chart showing what looks to be a pullback/correction of several days or so.
The 5 min is slightly leading negative, but much closer to in line, again along the lines of a near term pullback lasting perhaps 1-3 days.
Is interest rates about to start going up?
-
Yes, I know - it does not make any sense - FED is about to cut
rates...but....real world interest rates are not always what FED wants it
to be.
6 years ago


No comments:
Post a Comment