In this update I'll show you the longer term view of GLD that I have mentioned many times, but haven't featured as I have not felt it was a trade that was upon us yet.
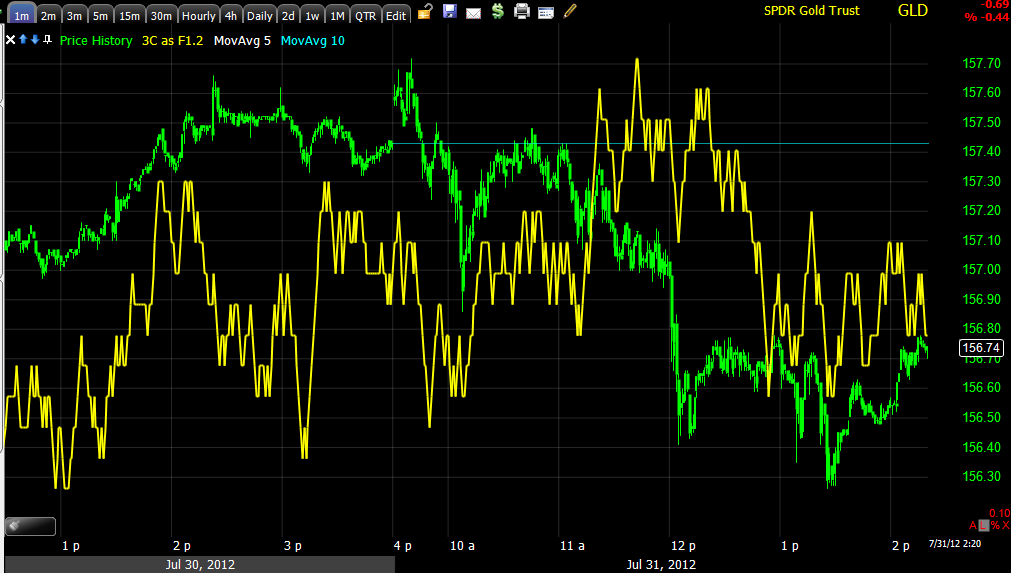
The 1 min chart seems to show a minor leading positive divergence today, it seems very minor, in fact, taking a closer look at intraday trade only for the 1 min GLD chart below...
This looks like one of those charts that I warned about in the last post, "Don't try to torture a signal out of the indicator". there clearly isn't a strong signal here so I'm not too interested in the first chart right now.
The 2 min chart's trend shows a clear signal, a leading negative position in GLD, it's not a long timeframe or exceptionally important, but fits with the price trend we are looking at.
The 3 min chart is in a larger relative negative divergence from the 19th and a leading negative divergence, I have felt GLD would most likely pullback toward the range it has been in the last couple of months, I DO NOT think GLD is a great short here on a pullback move, although if you are very nimble and use some leverage, it could work, it's just not with the probabilities.
The 5 min chart also is in a leading negative position, now we have several charts telling us the same thing, this is what builds probabilities.
Lately we have had very fast and very strong 1-day signals in the GLD 30 and 60 min charts, this is VERY rare, but since they have been there and have been successful, it's worth a look. The 30 min above shows a positive divergence sending GLD higher and a negative and leading negative divergence currently.
The 60 min chart shows the 1 day leading positive divergence to the far left that sent GLD up for it's biggest 1 day upside gain since 2009, that move was sold in to and we had traded GLD 4 or 5 times from the short side as the 60 min remained negative, then GLD started showing more positive character and we got off at least 1 long trade that went well, the 60 min right now looks to have a leading negative divergence as well as an overall leading negative position.
This is why I feel GLD will likely pullback, that also should tell s something about near term sentiment with regard to immediate QE3 this week.
However, looking at the daily chart, it does appear that the market feels QE3 will come at some point as it appears GLD is building a larger base for a bull move in the future.
Notice this chart covers years and went negative right where we called for an intermediate downtrend and got one, now action has a much more positive tone to it.
As for a near term pullback-FIRST EXPECT A LOT OF VOLATILITY WITH ANY F_O_M_C ANNOUNCEMENT, as I always warn, the initial knee jerk reaction is almost always reversed. I'm thinking GLD would need to pullback below the apex of the diamond, perhaps even a head fake move below the horizontal support. One day at a time though and we'll see what develops.


No comments:
Post a Comment