BIDU 15 min chart with this a.m. highlighted.
Here's the daily chart with the down trend, the head fake lows we identified, we expected a counter trend rally which BIDU has retraced 50% and then look at the very clear resistance of the last 2 weeks maybe and the head fake breakout.
Here's a closer look on a 30 min chart, resistance at the white line, when the red trendline is crossed, many longs will be at a loss, this is why head fake moves before a reversal are so common and effective, this also shows the larger trend in BIDU being a 30 min chart, these are the kinds of signals I take, I can't ignore a 30 min chart looking that bad. Sept $130 Puts are green this a.m.
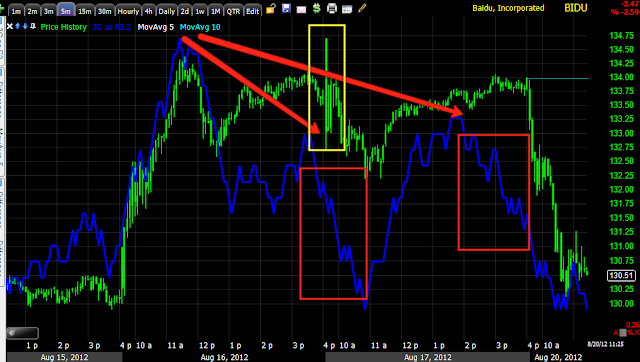
The 5 min chart and the break down of a head fake move, whenever there's a change in character of trade, you have to pay attention to it, like in the yellow box, extreme volatility/shakeout.
Intraday there's a slight positive divergence, maybe a n intraday oversold bounce, it really doesn't mean much to me, but BIDU is still in good position to consider as a short or add to.
The 2 min chart sees a little of that divergence from the 1 min
Nothing at the 3 min, as of now, any intraday price strength could be used for tactical entry advantage.
Is interest rates about to start going up?
-
Yes, I know - it does not make any sense - FED is about to cut
rates...but....real world interest rates are not always what FED wants it
to be.
6 years ago


No comments:
Post a Comment