I'm not giving up on FB either considering all the stop hunting from the Euro to AAPL, in every direction, up, down, sideways if they could.
The FB charts...
At the first bounce in August, some of us went long, but as soon as I saw the divergences suggesting the bounce I also warned not to expect much as I believe FB was going to build a larger base that would support a larger move. At first I thought maybe a "W" bottom, obviously it wasn't that.
Now it's looking more like a rounding bottom, but if that is a head fake move this a.m. then FB would be a lot closer to breaking to the upside than a rounding base would suggest.
For traders who hate FB any way, drawing trendlines like this isn't such a crime, this portrays a bearish descending triangle, the problem is it's too big and the trendlines aren't correct, but that's always been a problem in Technical Analysis, drawing trendlines to fit your outlook. Drawn correctly you actually have a bullish descending wedge. `
We had almost a year's worth of lessons on how wedges now act, rather than what Technical Analysis textbooks have taught for 6 or 7 decades, anyone remember?
Not that it really matters because drawn correctly FB is still in the bullish descending wedge, but the behavior we have seen over and over again for nearly a year while wedges were everywhere was not the breakout to the upside at the apex, it was a head fake breakdown making technical traders think the pattern failed and with the sentiment toward FB, technical traders would love that, then only after a trap was set did they either go laterally and then breakout as they are expected to or they just made the head fake move and then broke out as they were originally expected to, just another example of how a classic price pattern is manipulated, but technical traders refuse to adjust to the new realities of Wall St. manipulating them.
Intraday -1 min positive
The 1 min trend, leading positive
5 min has a large relative positive.
the 15 min has the most bullish, leading positive divergence FB has seen.
The hourly chart is much higher than it was at our last successful long trade.
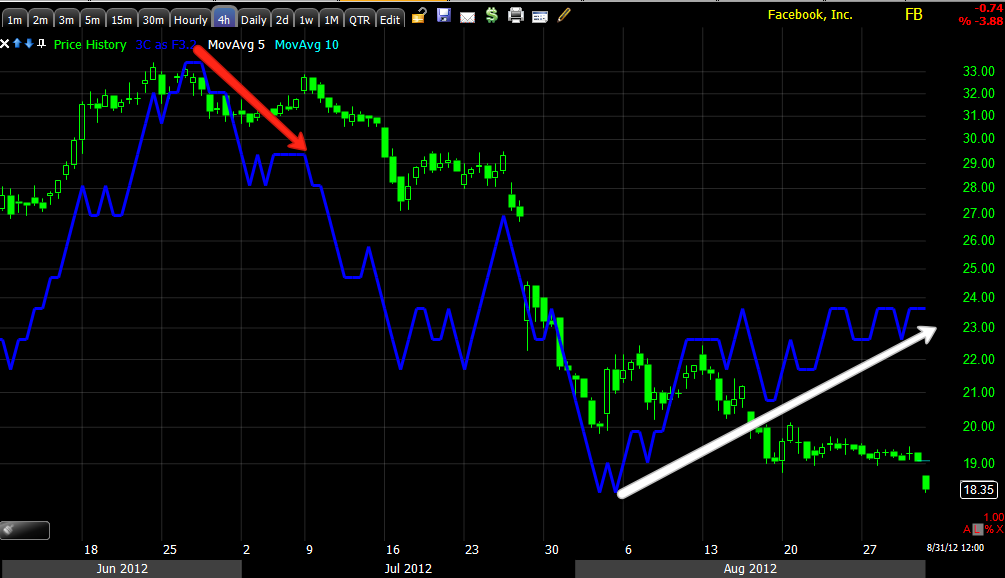
To clear away all noise and uncover trends, here's the 4 hour chart, a clear negative at the top, a clear positive here.
Since FB is a new issue we don't have much data for the daily chart, but what we have is positive right here.
I'm going to wait until today settles down and see what develops and decide if I want to take any action in FB, I won't be closing the currently open positions though, I don't have a reason to.


No comments:
Post a Comment