This is our 3rd large trade in BIDU and we've had many short term options trades as well. I recall BIDU in April of this year after having just made a breakout rom a triangle, I just had a new member sign up and I believe he was long BIDU and probably didn't quite understand why we were shorting a stock that just broke out. As I explained yesterday at my free site, www.Trade-Guild.net
in this post about head fake moves, BIDU was had already told us it was going down before it even broke out to the upside, which allowed us to use that upside breakout to short in to, while it's not easy emotionally for most people to short in to price strength, the underlying weakness told a different story and we got the best priced entry with the least amount of risk.
Since that trade which is still part of the core short positions in the equities model portfolio, we have taken a long trade in BIDU in early June on what I suspected would be a counter trend rally and has been and now a third trade (add to the original core short, plus some new options positions of which one was closed yesterday for a 100+% gain in 3 days). This third trade of course is short again as we look for the downtrend to resume, the point of the post last night was that all 3 trades gave us advance warning so we were able to let the trade come to us on another feature all three trades shared, a head fake move just before the reversal in which we were trading.
So here's a micro to macro look at BIDU, what is going on tactically and strategically as well as some target projections.
Firs a 5 day chart of BIDU; note the first rally in 2006-2007 was a healthy rally, it saw advancing volume with price, RSI went negative and there was the drop in to the 2009 lows. The rally since 2009 I have called a "House of Cards" built on F_E_D liquidity instead of real fundamentals, in my view, that makes this rally particularly thin and hollow with little support outside the Central Bank; you can see this in long term 3C charts, in Breadth charts in all kinds of metrics. Note the volume in to the 2009 rally and how it falls off, this is the sign of a sick rally that has little support, a serious crack can lead to a fall like we've never seen before because there's no time in history in which the world was so globalized, in which there has been so much Central Bank intervention, no one knows how bad it really will be, but my guess is, pretty bad.
The top formation gives us a rough downside price target of somewhere around $45-$50 using the top's measuring implications, in my experience more often than not these targets are on the conservative side.
Using my Trend Channel as a stop for BIDU, you could have made 900% in easy money and not been stopped out once during stage 2 mark-up. If you timed things perfectly there was another 225% to be made "IF" you could sell at the exact top and not be scared out of the position by one of the volatile moves down. For the most part, once the Trend Channel signals a stop, staying past that is just opportunity cost as the easy money has been made, the top is a lot of volatility and work.
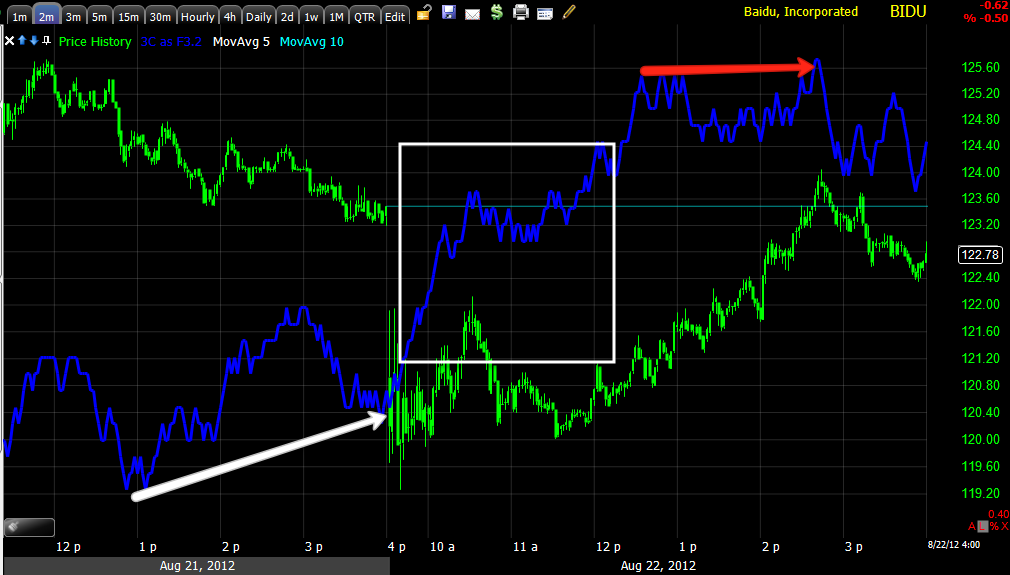
Looking at the micro, you recall today there were positive divergences that brought BIDU up to fill the gap, I was watching the shortest timeframes to see if the negative divergence would migrate to longer timeframes, giving us a good idea of when BIDU would be a prime short, although I think anywhere in this area is close enough. The 1 min chart did go negative as you can see.
Next, the 2 min chart earlier had shown no signs of a negative divergence, later in the day it did, so this is migration of the divergence, it is getting stronger.

The 3 min chart also saw a leading negative divergence at the end of the day, so BIDU is on track to giving us a short term entry signal.
As you can see, the divergence hasn't reached the 5 min chart yet as it is moving perfectly in line with price, once we hit the 5 min chart, we should have a strong enough signal to short BIDU if you are interested and didn't already.
The 30 min chart shows the head fake move that was exactly were we entered the Sept $130 puts for a quick 100% gain. You can see a positive divergence sending BIDU higher as we expected on a counter trend move and then at the flat range (as always) a nasty leading negative divergence and then a head fake move above resistance at the yellow arrow (this is almost always the last thing to happen before a reversal).
The 60 min chart is even more important and it reflects the April top and how bad the negative divergence is at the July rally, this also reflects that the move up was nothing more than a counter trend bear market rally.
The daily chart really seals the deal, note strong accumulation or Stage 1 in 2008/2009 then strong distribution in to 2011, now a leading negative divergence as the top is about to break on the next leg down.
It certainly is possible that BIDU breaks lower than $45, if all things were equal and there were no F_E_D intervention, I'd bet that it would break lower than $45.
I hope this helps with concepts and gives you some idea of why BIDU was an early favorite core short position.


No comments:
Post a Comment