Earlier I put out some signals we received today from trade in the SPY and ES specifically and I showed you what they were, where they were, etc.
My feeling about today's trade and the last several days is easier to sum up than to determine "why?"
Since QE3's original knee jerk reaction (and I warn about these all the time), there's been ZERO follow through on the initial move higher. Since that move higher there have been some fairly strong negative divergences driving price slowly lower. Tuesday of this week there seems to have been an accumulation area that sent prices up to their 2nd upper standard deviation channel on the ES weekly VWAP, from there as you might recall yesterday, there was a very fast sell off that immediately returned ES to VWAP from the upper 2x channel and that was on negative divergences, that followed through all night and today we saw some positive divergences at the opening gap down lows.
Despite divergences today, the theme seemed very much like keeping the market within an area which we have seen most often around this time of the week for option expiration weeks. A better tactic for accumulation would be for prices to drop or remain flat, although today was fairly flat as far as percentage change goes.
Lets take a look at the charts again, the more you look at them, the more the themes emerge.
SPY 1 min in to the close was negative for about the last 1.5 hours-just so you know what some of the closing trade looked like.
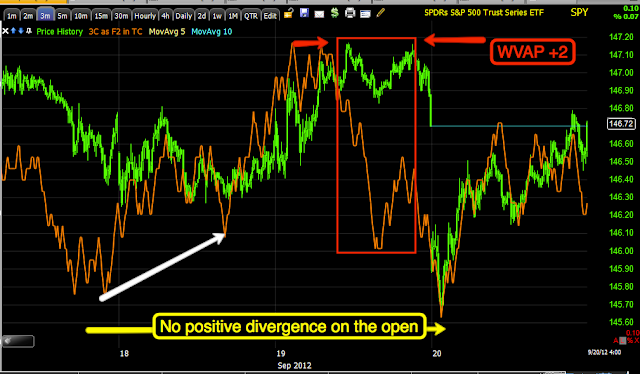
The 3 min chart shows the accumulation of the 18th at two areas which are virtually identical in price, from there ES and the SPY move up to the upper VWAP band (seen below), once there, the leading negative divergence is sharp, it seems obvious that they want to move the market or have received news that they know will move the market overnight, in any case, the negative divergence is sharp.
From the open this a.m., there is no positive divergence, not even a relative one and 3C traded in line with price all day, which makes it seem like smart money wasn't very active in positions, just in keeping price stable at this area-again most probably as an op-ex pin for tomorrow.
Here's the sharp negative divergences from yesterday exactly at the upper VWAP channel, proce fell from those leading negative divergences sharply and continued overnight.
The 10 min chart shows the same theme, the positive divergence and the strong leading negative yesterday at the highs, the intraday trade today was not showing strong leading positive divergences that would migrate to the 15 min chart, it was treading water.
If we look at the 15 min chart that at first look appears to have a strong positive divergence, a few thing jump out. First, the same theme or trends are present here, negative from the highs of the 13th, positive on the lows of the 18th like the other timeframes and negative at the highs yesterday. The 15 min chart shows a relative positive divergence on the open and price would seem to confirm it, but the problem is this, the 15 min chart never had the time between yesterday's close and today's open to move to any level that wouldn't have given a relative positive divergence! After noticing this, the only thing positive on the 15 min chart becomes its intraday trade which was at least in line and toward the afternoon leading positive.
So I have a lot of other averages to look at and see if there's other clues to be had. I don't know why the moves from the extreme low of VWAP to extreme highs took place, maybe stop and limit order hunting, it would seem more clear why they were so negative yesterday as there was likely a leak either from HSbC regarding China or maybe even the employment situation which the BLS openly acknowledges that they have leaks that give professionals unfair advantages.
Is interest rates about to start going up?
-
Yes, I know - it does not make any sense - FED is about to cut
rates...but....real world interest rates are not always what FED wants it
to be.
6 years ago


No comments:
Post a Comment